Jordanian vs Immigrants from Greece Hearing Disability
COMPARE
Jordanian
Immigrants from Greece
Hearing Disability
Hearing Disability Comparison
Jordanians
Immigrants from Greece
2.8%
HEARING DISABILITY
89.5/ 100
METRIC RATING
120th/ 347
METRIC RANK
3.0%
HEARING DISABILITY
57.9/ 100
METRIC RATING
168th/ 347
METRIC RANK
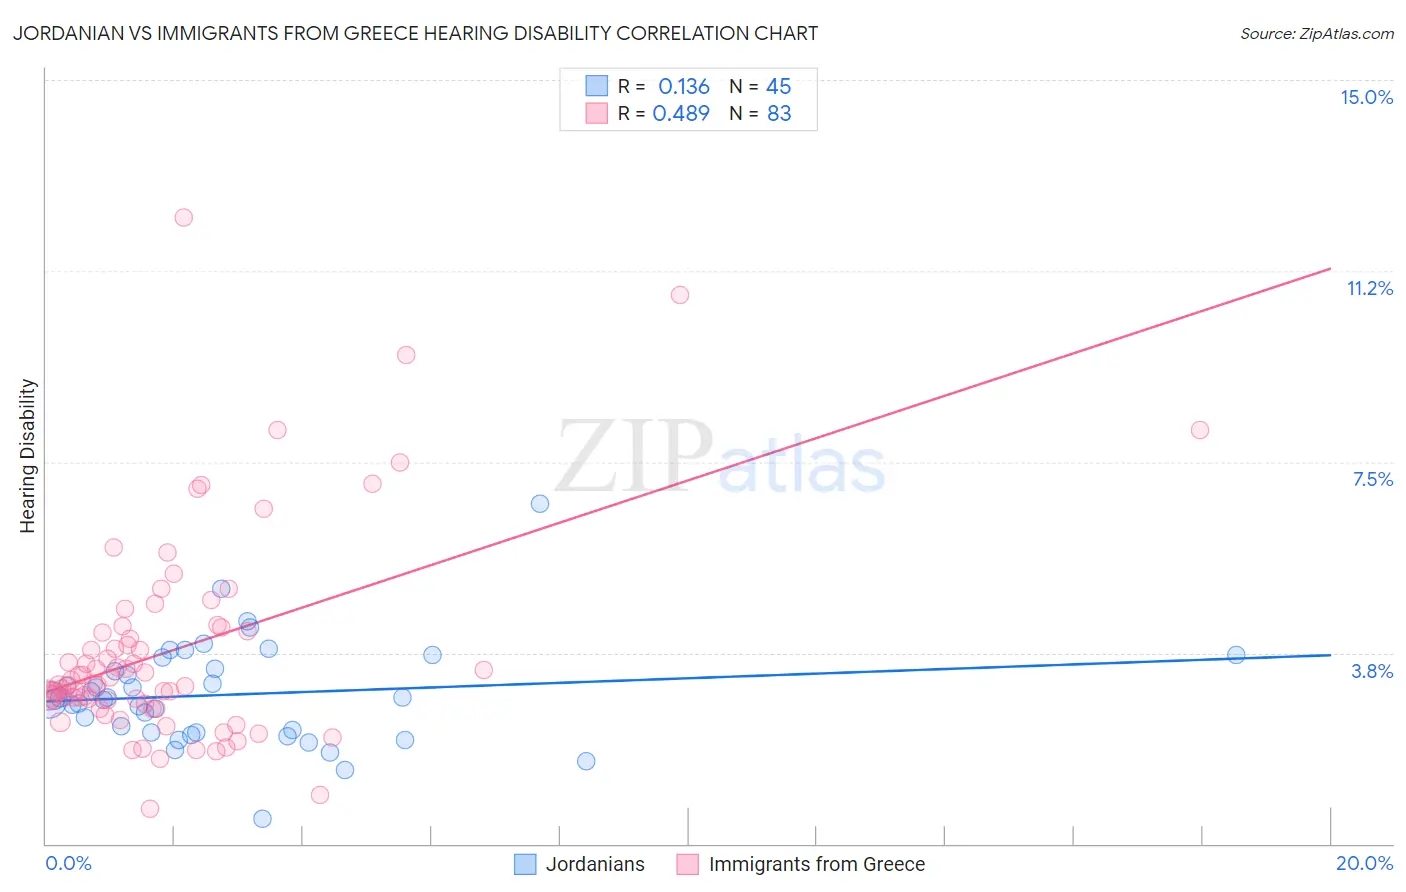
Jordanian vs Immigrants from Greece Hearing Disability Correlation Chart
The statistical analysis conducted on geographies consisting of 166,401,829 people shows a poor positive correlation between the proportion of Jordanians and percentage of population with hearing disability in the United States with a correlation coefficient (R) of 0.136 and weighted average of 2.8%. Similarly, the statistical analysis conducted on geographies consisting of 216,842,518 people shows a moderate positive correlation between the proportion of Immigrants from Greece and percentage of population with hearing disability in the United States with a correlation coefficient (R) of 0.489 and weighted average of 3.0%, a difference of 4.5%.
Hearing Disability Correlation Summary
| Measurement | Jordanian | Immigrants from Greece |
| Minimum | 0.50% | 0.70% |
| Maximum | 6.7% | 12.3% |
| Range | 6.2% | 11.6% |
| Mean | 2.9% | 3.8% |
| Median | 2.8% | 3.2% |
| Interquartile 25% (IQ1) | 2.2% | 2.8% |
| Interquartile 75% (IQ3) | 3.5% | 4.3% |
| Interquartile Range (IQR) | 1.4% | 1.5% |
| Standard Deviation (Sample) | 1.0% | 2.1% |
| Standard Deviation (Population) | 1.0% | 2.0% |
Similar Demographics by Hearing Disability
Demographics Similar to Jordanians by Hearing Disability
In terms of hearing disability, the demographic groups most similar to Jordanians are Cuban (2.8%, a difference of 0.030%), Kenyan (2.8%, a difference of 0.090%), Zimbabwean (2.8%, a difference of 0.11%), Immigrants from Liberia (2.8%, a difference of 0.13%), and Liberian (2.8%, a difference of 0.13%).
| Demographics | Rating | Rank | Hearing Disability |
| Immigrants | Belarus | 91.6 /100 | #113 | Exceptional 2.8% |
| Cambodians | 91.1 /100 | #114 | Exceptional 2.8% |
| Immigrants | Latin America | 90.5 /100 | #115 | Exceptional 2.8% |
| Immigrants | Immigrants | 90.3 /100 | #116 | Exceptional 2.8% |
| Immigrants | Liberia | 90.0 /100 | #117 | Excellent 2.8% |
| Zimbabweans | 89.9 /100 | #118 | Excellent 2.8% |
| Kenyans | 89.8 /100 | #119 | Excellent 2.8% |
| Jordanians | 89.5 /100 | #120 | Excellent 2.8% |
| Cubans | 89.4 /100 | #121 | Excellent 2.8% |
| Liberians | 89.0 /100 | #122 | Excellent 2.8% |
| Immigrants | Zaire | 88.6 /100 | #123 | Excellent 2.9% |
| Bahamians | 88.6 /100 | #124 | Excellent 2.9% |
| Immigrants | Albania | 88.5 /100 | #125 | Excellent 2.9% |
| Immigrants | Sudan | 87.8 /100 | #126 | Excellent 2.9% |
| South American Indians | 86.9 /100 | #127 | Excellent 2.9% |
Demographics Similar to Immigrants from Greece by Hearing Disability
In terms of hearing disability, the demographic groups most similar to Immigrants from Greece are Immigrants from Eastern Europe (3.0%, a difference of 0.020%), Arab (3.0%, a difference of 0.030%), Immigrants from Cabo Verde (3.0%, a difference of 0.10%), Immigrants from Ukraine (3.0%, a difference of 0.12%), and Armenian (3.0%, a difference of 0.18%).
| Demographics | Rating | Rank | Hearing Disability |
| Albanians | 66.6 /100 | #161 | Good 2.9% |
| Immigrants | Japan | 66.3 /100 | #162 | Good 2.9% |
| Immigrants | Central America | 64.9 /100 | #163 | Good 3.0% |
| Immigrants | Cambodia | 64.8 /100 | #164 | Good 3.0% |
| Immigrants | Zimbabwe | 64.2 /100 | #165 | Good 3.0% |
| Immigrants | South Eastern Asia | 62.9 /100 | #166 | Good 3.0% |
| Immigrants | Eastern Europe | 58.1 /100 | #167 | Average 3.0% |
| Immigrants | Greece | 57.9 /100 | #168 | Average 3.0% |
| Arabs | 57.6 /100 | #169 | Average 3.0% |
| Immigrants | Cabo Verde | 56.9 /100 | #170 | Average 3.0% |
| Immigrants | Ukraine | 56.6 /100 | #171 | Average 3.0% |
| Armenians | 56.0 /100 | #172 | Average 3.0% |
| Immigrants | Serbia | 51.1 /100 | #173 | Average 3.0% |
| Indonesians | 50.0 /100 | #174 | Average 3.0% |
| Immigrants | Romania | 48.4 /100 | #175 | Average 3.0% |