Honduran vs Immigrants from Greece Hearing Disability
COMPARE
Honduran
Immigrants from Greece
Hearing Disability
Hearing Disability Comparison
Hondurans
Immigrants from Greece
2.8%
HEARING DISABILITY
93.4/ 100
METRIC RATING
106th/ 347
METRIC RANK
3.0%
HEARING DISABILITY
57.9/ 100
METRIC RATING
168th/ 347
METRIC RANK
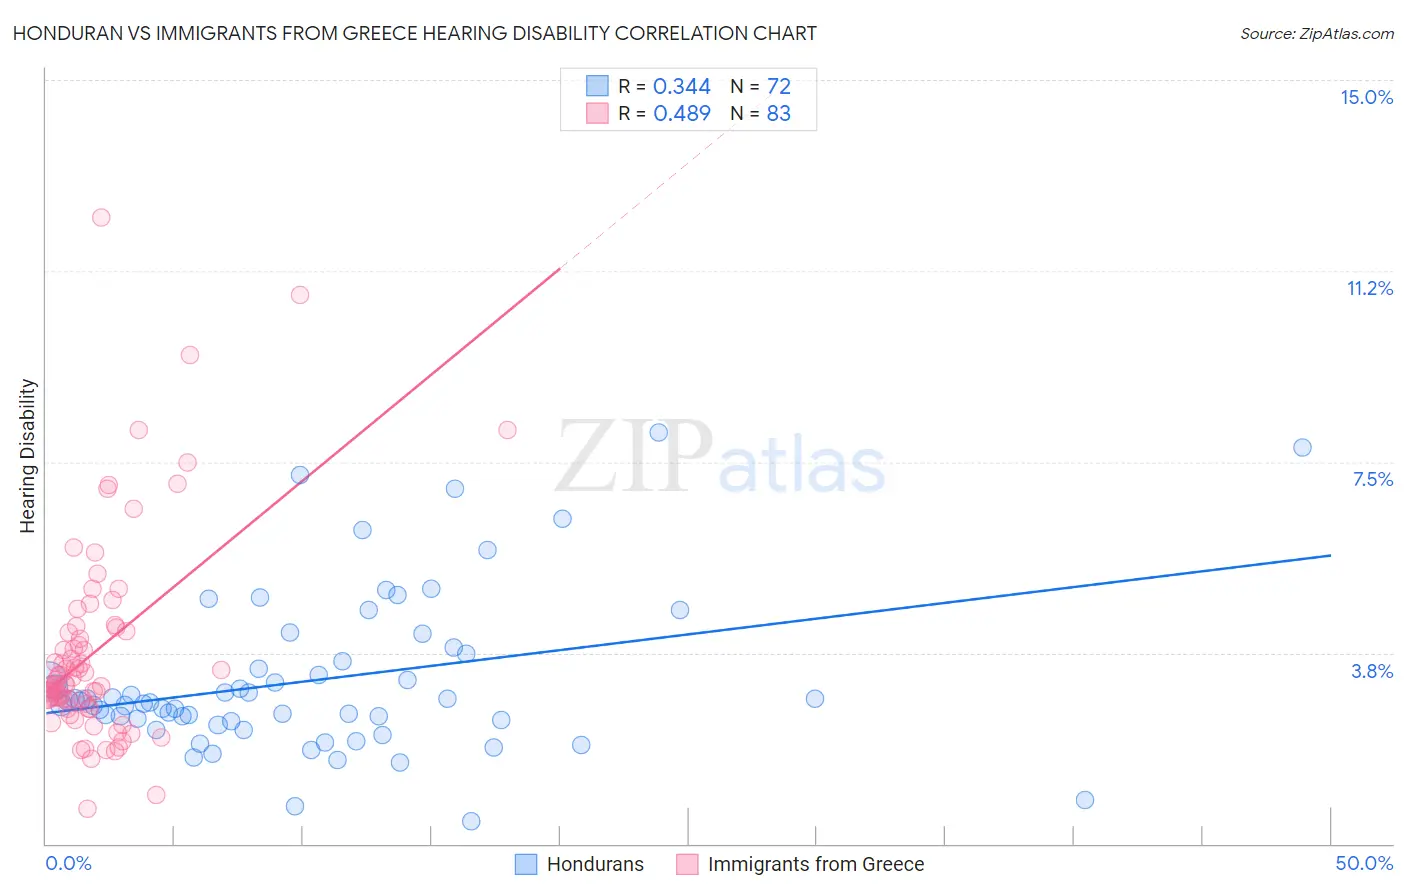
Honduran vs Immigrants from Greece Hearing Disability Correlation Chart
The statistical analysis conducted on geographies consisting of 357,671,786 people shows a mild positive correlation between the proportion of Hondurans and percentage of population with hearing disability in the United States with a correlation coefficient (R) of 0.344 and weighted average of 2.8%. Similarly, the statistical analysis conducted on geographies consisting of 216,842,518 people shows a moderate positive correlation between the proportion of Immigrants from Greece and percentage of population with hearing disability in the United States with a correlation coefficient (R) of 0.489 and weighted average of 3.0%, a difference of 5.8%.
Hearing Disability Correlation Summary
| Measurement | Honduran | Immigrants from Greece |
| Minimum | 0.44% | 0.70% |
| Maximum | 8.1% | 12.3% |
| Range | 7.6% | 11.6% |
| Mean | 3.2% | 3.8% |
| Median | 2.8% | 3.2% |
| Interquartile 25% (IQ1) | 2.4% | 2.8% |
| Interquartile 75% (IQ3) | 3.7% | 4.3% |
| Interquartile Range (IQR) | 1.2% | 1.5% |
| Standard Deviation (Sample) | 1.6% | 2.1% |
| Standard Deviation (Population) | 1.5% | 2.0% |
Similar Demographics by Hearing Disability
Demographics Similar to Hondurans by Hearing Disability
In terms of hearing disability, the demographic groups most similar to Hondurans are Immigrants from Chile (2.8%, a difference of 0.0%), Guatemalan (2.8%, a difference of 0.080%), Turkish (2.8%, a difference of 0.15%), Cypriot (2.8%, a difference of 0.20%), and Moroccan (2.8%, a difference of 0.24%).
| Demographics | Rating | Rank | Hearing Disability |
| Immigrants | Guatemala | 95.1 /100 | #99 | Exceptional 2.8% |
| Immigrants | Eastern Africa | 95.0 /100 | #100 | Exceptional 2.8% |
| Immigrants | Spain | 94.9 /100 | #101 | Exceptional 2.8% |
| Taiwanese | 94.8 /100 | #102 | Exceptional 2.8% |
| Immigrants | Indonesia | 94.7 /100 | #103 | Exceptional 2.8% |
| Burmese | 94.2 /100 | #104 | Exceptional 2.8% |
| Moroccans | 93.9 /100 | #105 | Exceptional 2.8% |
| Hondurans | 93.4 /100 | #106 | Exceptional 2.8% |
| Immigrants | Chile | 93.4 /100 | #107 | Exceptional 2.8% |
| Guatemalans | 93.2 /100 | #108 | Exceptional 2.8% |
| Turks | 93.0 /100 | #109 | Exceptional 2.8% |
| Cypriots | 92.9 /100 | #110 | Exceptional 2.8% |
| Immigrants | Yemen | 92.7 /100 | #111 | Exceptional 2.8% |
| U.S. Virgin Islanders | 92.5 /100 | #112 | Exceptional 2.8% |
| Immigrants | Belarus | 91.6 /100 | #113 | Exceptional 2.8% |
Demographics Similar to Immigrants from Greece by Hearing Disability
In terms of hearing disability, the demographic groups most similar to Immigrants from Greece are Immigrants from Eastern Europe (3.0%, a difference of 0.020%), Arab (3.0%, a difference of 0.030%), Immigrants from Cabo Verde (3.0%, a difference of 0.10%), Immigrants from Ukraine (3.0%, a difference of 0.12%), and Armenian (3.0%, a difference of 0.18%).
| Demographics | Rating | Rank | Hearing Disability |
| Albanians | 66.6 /100 | #161 | Good 2.9% |
| Immigrants | Japan | 66.3 /100 | #162 | Good 2.9% |
| Immigrants | Central America | 64.9 /100 | #163 | Good 3.0% |
| Immigrants | Cambodia | 64.8 /100 | #164 | Good 3.0% |
| Immigrants | Zimbabwe | 64.2 /100 | #165 | Good 3.0% |
| Immigrants | South Eastern Asia | 62.9 /100 | #166 | Good 3.0% |
| Immigrants | Eastern Europe | 58.1 /100 | #167 | Average 3.0% |
| Immigrants | Greece | 57.9 /100 | #168 | Average 3.0% |
| Arabs | 57.6 /100 | #169 | Average 3.0% |
| Immigrants | Cabo Verde | 56.9 /100 | #170 | Average 3.0% |
| Immigrants | Ukraine | 56.6 /100 | #171 | Average 3.0% |
| Armenians | 56.0 /100 | #172 | Average 3.0% |
| Immigrants | Serbia | 51.1 /100 | #173 | Average 3.0% |
| Indonesians | 50.0 /100 | #174 | Average 3.0% |
| Immigrants | Romania | 48.4 /100 | #175 | Average 3.0% |