Sioux vs Immigrants from Greece Hearing Disability
COMPARE
Sioux
Immigrants from Greece
Hearing Disability
Hearing Disability Comparison
Sioux
Immigrants from Greece
3.6%
HEARING DISABILITY
0.0/ 100
METRIC RATING
285th/ 347
METRIC RANK
3.0%
HEARING DISABILITY
57.9/ 100
METRIC RATING
168th/ 347
METRIC RANK
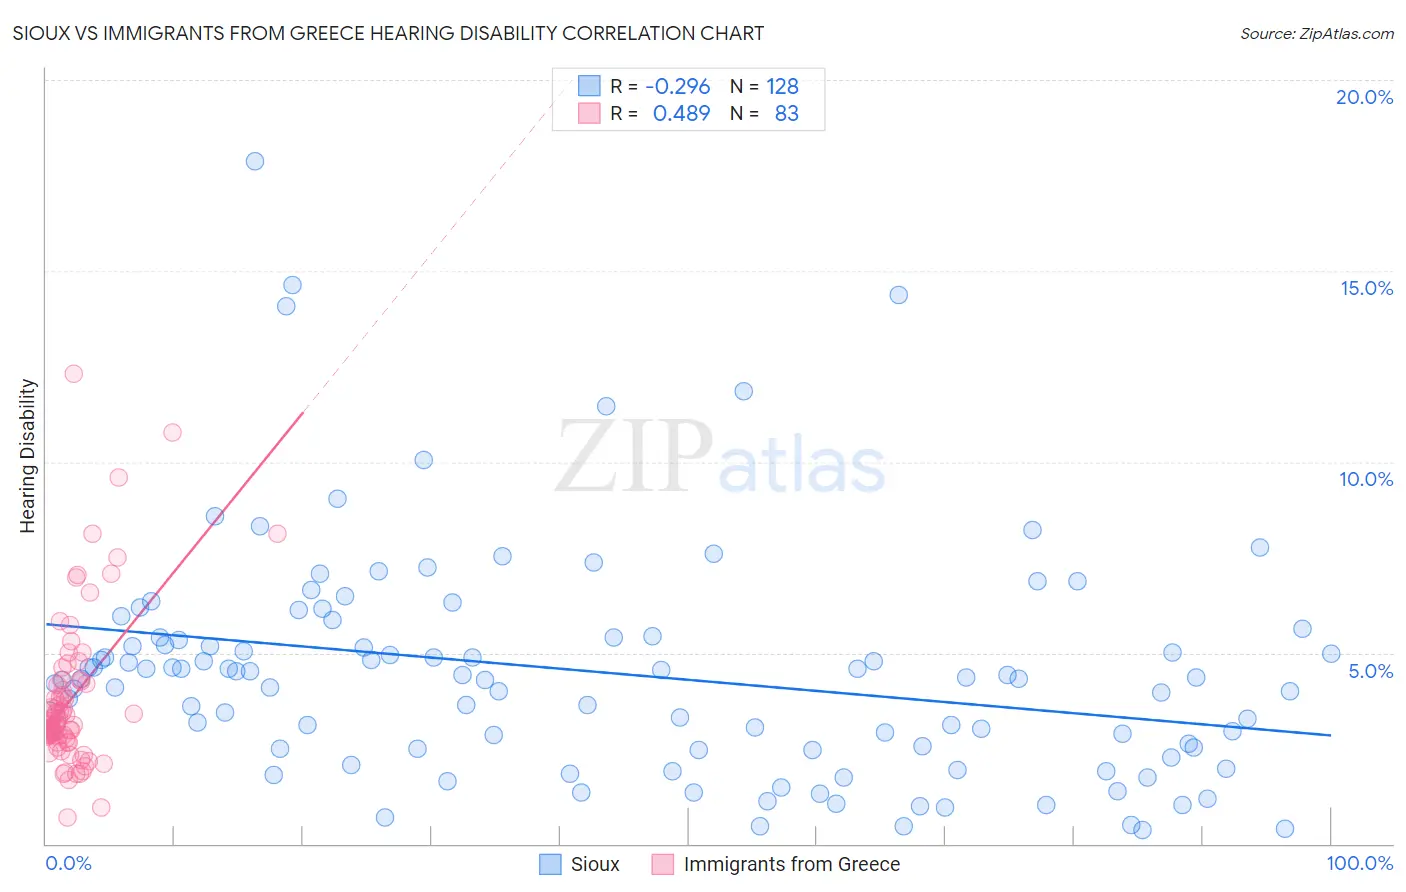
Sioux vs Immigrants from Greece Hearing Disability Correlation Chart
The statistical analysis conducted on geographies consisting of 234,128,884 people shows a weak negative correlation between the proportion of Sioux and percentage of population with hearing disability in the United States with a correlation coefficient (R) of -0.296 and weighted average of 3.6%. Similarly, the statistical analysis conducted on geographies consisting of 216,842,518 people shows a moderate positive correlation between the proportion of Immigrants from Greece and percentage of population with hearing disability in the United States with a correlation coefficient (R) of 0.489 and weighted average of 3.0%, a difference of 22.5%.
Hearing Disability Correlation Summary
| Measurement | Sioux | Immigrants from Greece |
| Minimum | 0.37% | 0.70% |
| Maximum | 17.9% | 12.3% |
| Range | 17.5% | 11.6% |
| Mean | 4.5% | 3.8% |
| Median | 4.3% | 3.2% |
| Interquartile 25% (IQ1) | 2.5% | 2.8% |
| Interquartile 75% (IQ3) | 5.4% | 4.3% |
| Interquartile Range (IQR) | 2.9% | 1.5% |
| Standard Deviation (Sample) | 3.0% | 2.1% |
| Standard Deviation (Population) | 3.0% | 2.0% |
Similar Demographics by Hearing Disability
Demographics Similar to Sioux by Hearing Disability
In terms of hearing disability, the demographic groups most similar to Sioux are Delaware (3.6%, a difference of 0.030%), Immigrants from Micronesia (3.6%, a difference of 0.10%), Spanish (3.7%, a difference of 0.28%), Blackfeet (3.6%, a difference of 0.57%), and Swedish (3.6%, a difference of 0.82%).
| Demographics | Rating | Rank | Hearing Disability |
| Basques | 0.0 /100 | #278 | Tragic 3.6% |
| Slovaks | 0.0 /100 | #279 | Tragic 3.6% |
| French American Indians | 0.0 /100 | #280 | Tragic 3.6% |
| Scandinavians | 0.0 /100 | #281 | Tragic 3.6% |
| Swedes | 0.0 /100 | #282 | Tragic 3.6% |
| Blackfeet | 0.0 /100 | #283 | Tragic 3.6% |
| Immigrants | Micronesia | 0.0 /100 | #284 | Tragic 3.6% |
| Sioux | 0.0 /100 | #285 | Tragic 3.6% |
| Delaware | 0.0 /100 | #286 | Tragic 3.6% |
| Spanish | 0.0 /100 | #287 | Tragic 3.7% |
| Irish | 0.0 /100 | #288 | Tragic 3.7% |
| Chinese | 0.0 /100 | #289 | Tragic 3.7% |
| Whites/Caucasians | 0.0 /100 | #290 | Tragic 3.7% |
| Finns | 0.0 /100 | #291 | Tragic 3.7% |
| Native Hawaiians | 0.0 /100 | #292 | Tragic 3.7% |
Demographics Similar to Immigrants from Greece by Hearing Disability
In terms of hearing disability, the demographic groups most similar to Immigrants from Greece are Immigrants from Eastern Europe (3.0%, a difference of 0.020%), Arab (3.0%, a difference of 0.030%), Immigrants from Cabo Verde (3.0%, a difference of 0.10%), Immigrants from Ukraine (3.0%, a difference of 0.12%), and Armenian (3.0%, a difference of 0.18%).
| Demographics | Rating | Rank | Hearing Disability |
| Albanians | 66.6 /100 | #161 | Good 2.9% |
| Immigrants | Japan | 66.3 /100 | #162 | Good 2.9% |
| Immigrants | Central America | 64.9 /100 | #163 | Good 3.0% |
| Immigrants | Cambodia | 64.8 /100 | #164 | Good 3.0% |
| Immigrants | Zimbabwe | 64.2 /100 | #165 | Good 3.0% |
| Immigrants | South Eastern Asia | 62.9 /100 | #166 | Good 3.0% |
| Immigrants | Eastern Europe | 58.1 /100 | #167 | Average 3.0% |
| Immigrants | Greece | 57.9 /100 | #168 | Average 3.0% |
| Arabs | 57.6 /100 | #169 | Average 3.0% |
| Immigrants | Cabo Verde | 56.9 /100 | #170 | Average 3.0% |
| Immigrants | Ukraine | 56.6 /100 | #171 | Average 3.0% |
| Armenians | 56.0 /100 | #172 | Average 3.0% |
| Immigrants | Serbia | 51.1 /100 | #173 | Average 3.0% |
| Indonesians | 50.0 /100 | #174 | Average 3.0% |
| Immigrants | Romania | 48.4 /100 | #175 | Average 3.0% |