Senegalese vs Immigrants from Dominican Republic Cognitive Disability
COMPARE
Senegalese
Immigrants from Dominican Republic
Cognitive Disability
Cognitive Disability Comparison
Senegalese
Immigrants from Dominican Republic
19.0%
COGNITIVE DISABILITY
0.0/ 100
METRIC RATING
335th/ 347
METRIC RANK
18.8%
COGNITIVE DISABILITY
0.0/ 100
METRIC RATING
330th/ 347
METRIC RANK
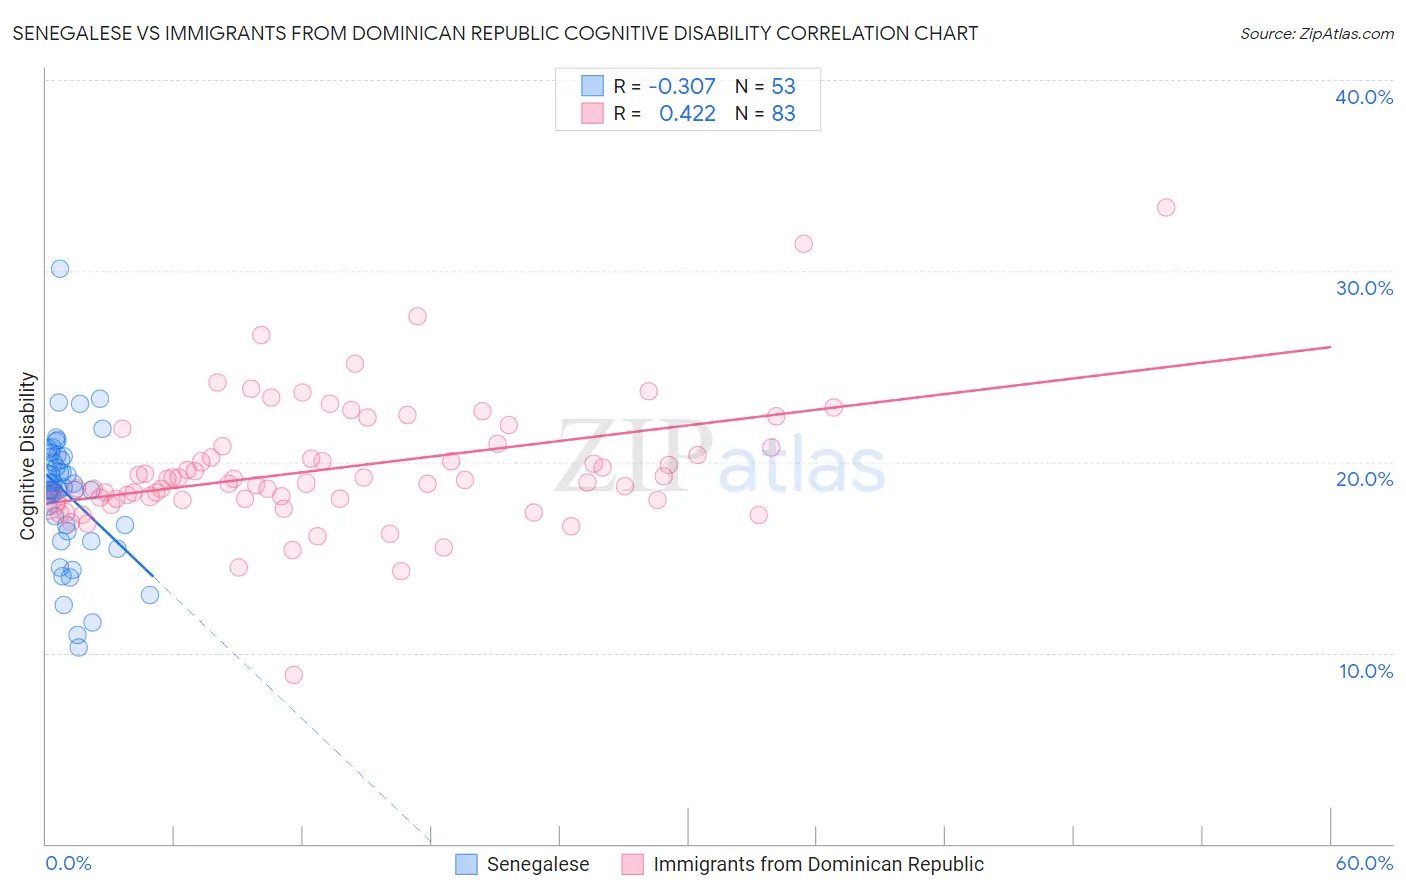
Senegalese vs Immigrants from Dominican Republic Cognitive Disability Correlation Chart
The statistical analysis conducted on geographies consisting of 78,141,567 people shows a mild negative correlation between the proportion of Senegalese and percentage of population with cognitive disability in the United States with a correlation coefficient (R) of -0.307 and weighted average of 19.0%. Similarly, the statistical analysis conducted on geographies consisting of 275,093,930 people shows a moderate positive correlation between the proportion of Immigrants from Dominican Republic and percentage of population with cognitive disability in the United States with a correlation coefficient (R) of 0.422 and weighted average of 18.8%, a difference of 1.1%.
Cognitive Disability Correlation Summary
| Measurement | Senegalese | Immigrants from Dominican Republic |
| Minimum | 10.3% | 8.8% |
| Maximum | 30.1% | 33.3% |
| Range | 19.8% | 24.5% |
| Mean | 18.3% | 19.7% |
| Median | 18.6% | 19.1% |
| Interquartile 25% (IQ1) | 16.5% | 18.0% |
| Interquartile 75% (IQ3) | 20.3% | 20.8% |
| Interquartile Range (IQR) | 3.8% | 2.8% |
| Standard Deviation (Sample) | 3.4% | 3.4% |
| Standard Deviation (Population) | 3.4% | 3.4% |
Demographics Similar to Senegalese and Immigrants from Dominican Republic by Cognitive Disability
In terms of cognitive disability, the demographic groups most similar to Senegalese are Black/African American (19.0%, a difference of 0.29%), Immigrants from Saudi Arabia (19.1%, a difference of 0.42%), Sudanese (18.9%, a difference of 0.54%), Lumbee (19.1%, a difference of 0.77%), and Immigrants from Yemen (18.8%, a difference of 0.93%). Similarly, the demographic groups most similar to Immigrants from Dominican Republic are Pima (18.8%, a difference of 0.070%), Immigrants from Sudan (18.8%, a difference of 0.080%), Navajo (18.8%, a difference of 0.10%), Immigrants from Yemen (18.8%, a difference of 0.14%), and Kiowa (18.7%, a difference of 0.32%).
| Demographics | Rating | Rank | Cognitive Disability |
| Immigrants | Liberia | 0.0 /100 | #322 | Tragic 18.7% |
| Pueblo | 0.0 /100 | #323 | Tragic 18.7% |
| Dominicans | 0.0 /100 | #324 | Tragic 18.7% |
| Indonesians | 0.0 /100 | #325 | Tragic 18.7% |
| Immigrants | Senegal | 0.0 /100 | #326 | Tragic 18.7% |
| U.S. Virgin Islanders | 0.0 /100 | #327 | Tragic 18.7% |
| Kiowa | 0.0 /100 | #328 | Tragic 18.7% |
| Navajo | 0.0 /100 | #329 | Tragic 18.8% |
| Immigrants | Dominican Republic | 0.0 /100 | #330 | Tragic 18.8% |
| Pima | 0.0 /100 | #331 | Tragic 18.8% |
| Immigrants | Sudan | 0.0 /100 | #332 | Tragic 18.8% |
| Immigrants | Yemen | 0.0 /100 | #333 | Tragic 18.8% |
| Sudanese | 0.0 /100 | #334 | Tragic 18.9% |
| Senegalese | 0.0 /100 | #335 | Tragic 19.0% |
| Blacks/African Americans | 0.0 /100 | #336 | Tragic 19.0% |
| Immigrants | Saudi Arabia | 0.0 /100 | #337 | Tragic 19.1% |
| Lumbee | 0.0 /100 | #338 | Tragic 19.1% |
| Puerto Ricans | 0.0 /100 | #339 | Tragic 19.2% |
| Cape Verdeans | 0.0 /100 | #340 | Tragic 19.2% |
| Tohono O'odham | 0.0 /100 | #341 | Tragic 19.3% |
| Houma | 0.0 /100 | #342 | Tragic 19.3% |