Immigrants from Belgium vs Immigrants from Dominican Republic Cognitive Disability
COMPARE
Immigrants from Belgium
Immigrants from Dominican Republic
Cognitive Disability
Cognitive Disability Comparison
Immigrants from Belgium
Immigrants from Dominican Republic
16.7%
COGNITIVE DISABILITY
99.3/ 100
METRIC RATING
71st/ 347
METRIC RANK
18.8%
COGNITIVE DISABILITY
0.0/ 100
METRIC RATING
330th/ 347
METRIC RANK
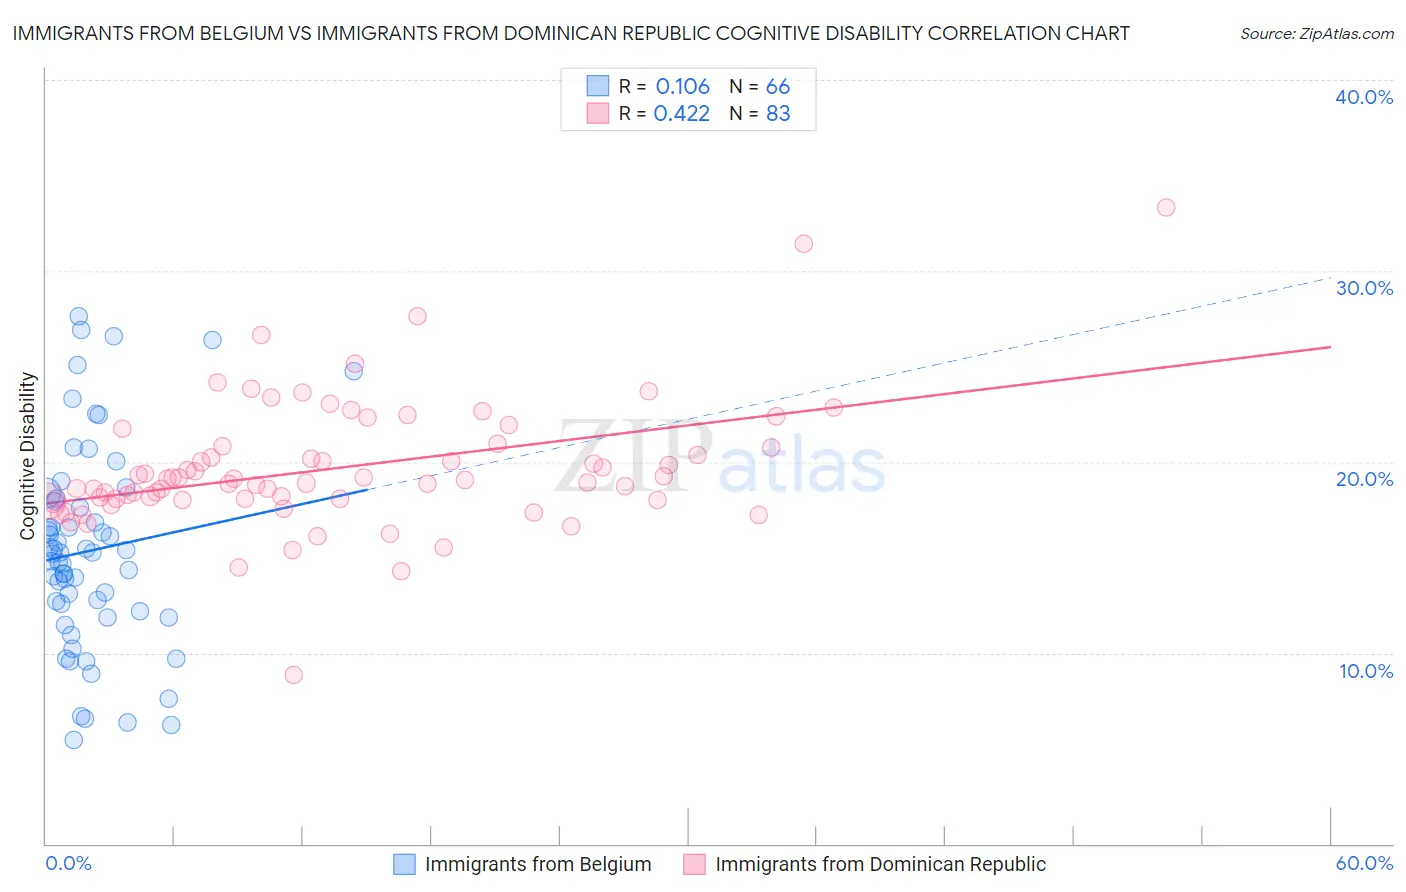
Immigrants from Belgium vs Immigrants from Dominican Republic Cognitive Disability Correlation Chart
The statistical analysis conducted on geographies consisting of 146,717,963 people shows a poor positive correlation between the proportion of Immigrants from Belgium and percentage of population with cognitive disability in the United States with a correlation coefficient (R) of 0.106 and weighted average of 16.7%. Similarly, the statistical analysis conducted on geographies consisting of 275,093,930 people shows a moderate positive correlation between the proportion of Immigrants from Dominican Republic and percentage of population with cognitive disability in the United States with a correlation coefficient (R) of 0.422 and weighted average of 18.8%, a difference of 12.7%.
Cognitive Disability Correlation Summary
| Measurement | Immigrants from Belgium | Immigrants from Dominican Republic |
| Minimum | 5.4% | 8.8% |
| Maximum | 27.7% | 33.3% |
| Range | 22.2% | 24.5% |
| Mean | 15.3% | 19.7% |
| Median | 15.2% | 19.1% |
| Interquartile 25% (IQ1) | 12.2% | 18.0% |
| Interquartile 75% (IQ3) | 17.9% | 20.8% |
| Interquartile Range (IQR) | 5.8% | 2.8% |
| Standard Deviation (Sample) | 5.3% | 3.4% |
| Standard Deviation (Population) | 5.2% | 3.4% |
Similar Demographics by Cognitive Disability
Demographics Similar to Immigrants from Belgium by Cognitive Disability
In terms of cognitive disability, the demographic groups most similar to Immigrants from Belgium are Immigrants from Sweden (16.7%, a difference of 0.010%), Immigrants from Uzbekistan (16.7%, a difference of 0.020%), German (16.7%, a difference of 0.020%), Burmese (16.7%, a difference of 0.020%), and Slavic (16.7%, a difference of 0.030%).
| Demographics | Rating | Rank | Cognitive Disability |
| Venezuelans | 99.6 /100 | #64 | Exceptional 16.6% |
| Colombians | 99.6 /100 | #65 | Exceptional 16.6% |
| Immigrants | Ukraine | 99.5 /100 | #66 | Exceptional 16.6% |
| Latvians | 99.5 /100 | #67 | Exceptional 16.6% |
| Ukrainians | 99.4 /100 | #68 | Exceptional 16.6% |
| Immigrants | Uzbekistan | 99.4 /100 | #69 | Exceptional 16.7% |
| Immigrants | Sweden | 99.4 /100 | #70 | Exceptional 16.7% |
| Immigrants | Belgium | 99.3 /100 | #71 | Exceptional 16.7% |
| Germans | 99.3 /100 | #72 | Exceptional 16.7% |
| Burmese | 99.3 /100 | #73 | Exceptional 16.7% |
| Slavs | 99.3 /100 | #74 | Exceptional 16.7% |
| Estonians | 99.3 /100 | #75 | Exceptional 16.7% |
| Immigrants | Serbia | 99.3 /100 | #76 | Exceptional 16.7% |
| Immigrants | Hungary | 99.3 /100 | #77 | Exceptional 16.7% |
| Peruvians | 99.3 /100 | #78 | Exceptional 16.7% |
Demographics Similar to Immigrants from Dominican Republic by Cognitive Disability
In terms of cognitive disability, the demographic groups most similar to Immigrants from Dominican Republic are Pima (18.8%, a difference of 0.070%), Immigrants from Sudan (18.8%, a difference of 0.080%), Navajo (18.8%, a difference of 0.10%), Immigrants from Yemen (18.8%, a difference of 0.14%), and Kiowa (18.7%, a difference of 0.32%).
| Demographics | Rating | Rank | Cognitive Disability |
| Pueblo | 0.0 /100 | #323 | Tragic 18.7% |
| Dominicans | 0.0 /100 | #324 | Tragic 18.7% |
| Indonesians | 0.0 /100 | #325 | Tragic 18.7% |
| Immigrants | Senegal | 0.0 /100 | #326 | Tragic 18.7% |
| U.S. Virgin Islanders | 0.0 /100 | #327 | Tragic 18.7% |
| Kiowa | 0.0 /100 | #328 | Tragic 18.7% |
| Navajo | 0.0 /100 | #329 | Tragic 18.8% |
| Immigrants | Dominican Republic | 0.0 /100 | #330 | Tragic 18.8% |
| Pima | 0.0 /100 | #331 | Tragic 18.8% |
| Immigrants | Sudan | 0.0 /100 | #332 | Tragic 18.8% |
| Immigrants | Yemen | 0.0 /100 | #333 | Tragic 18.8% |
| Sudanese | 0.0 /100 | #334 | Tragic 18.9% |
| Senegalese | 0.0 /100 | #335 | Tragic 19.0% |
| Blacks/African Americans | 0.0 /100 | #336 | Tragic 19.0% |
| Immigrants | Saudi Arabia | 0.0 /100 | #337 | Tragic 19.1% |