Turkish vs Paraguayan Cognitive Disability
COMPARE
Turkish
Paraguayan
Cognitive Disability
Cognitive Disability Comparison
Turks
Paraguayans
16.9%
COGNITIVE DISABILITY
94.5/ 100
METRIC RATING
124th/ 347
METRIC RANK
16.8%
COGNITIVE DISABILITY
98.0/ 100
METRIC RATING
103rd/ 347
METRIC RANK
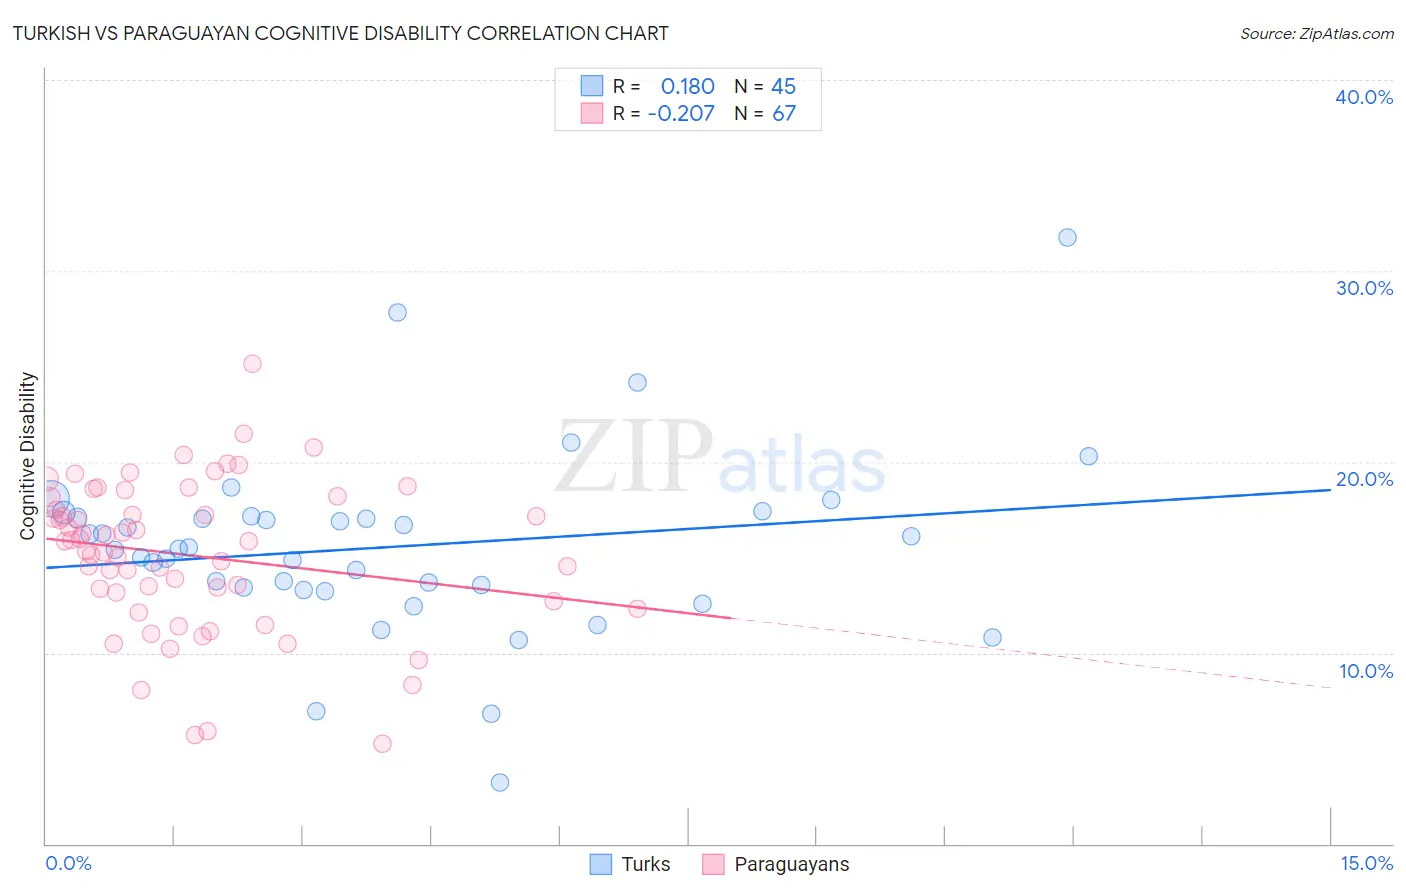
Turkish vs Paraguayan Cognitive Disability Correlation Chart
The statistical analysis conducted on geographies consisting of 271,856,342 people shows a poor positive correlation between the proportion of Turks and percentage of population with cognitive disability in the United States with a correlation coefficient (R) of 0.180 and weighted average of 16.9%. Similarly, the statistical analysis conducted on geographies consisting of 95,106,732 people shows a weak negative correlation between the proportion of Paraguayans and percentage of population with cognitive disability in the United States with a correlation coefficient (R) of -0.207 and weighted average of 16.8%, a difference of 0.75%.
Cognitive Disability Correlation Summary
| Measurement | Turkish | Paraguayan |
| Minimum | 3.2% | 5.3% |
| Maximum | 31.8% | 25.1% |
| Range | 28.5% | 19.9% |
| Mean | 15.5% | 15.1% |
| Median | 15.5% | 15.9% |
| Interquartile 25% (IQ1) | 13.4% | 12.7% |
| Interquartile 75% (IQ3) | 17.1% | 18.2% |
| Interquartile Range (IQR) | 3.8% | 5.4% |
| Standard Deviation (Sample) | 4.8% | 3.9% |
| Standard Deviation (Population) | 4.8% | 3.9% |
Similar Demographics by Cognitive Disability
Demographics Similar to Turks by Cognitive Disability
In terms of cognitive disability, the demographic groups most similar to Turks are Portuguese (16.9%, a difference of 0.020%), Immigrants from Western Europe (16.9%, a difference of 0.030%), Immigrants from China (16.9%, a difference of 0.050%), Scandinavian (16.9%, a difference of 0.050%), and Scottish (16.9%, a difference of 0.070%).
| Demographics | Rating | Rank | Cognitive Disability |
| Immigrants | Japan | 96.2 /100 | #117 | Exceptional 16.9% |
| Immigrants | Denmark | 96.2 /100 | #118 | Exceptional 16.9% |
| South Africans | 95.5 /100 | #119 | Exceptional 16.9% |
| Scottish | 95.0 /100 | #120 | Exceptional 16.9% |
| Immigrants | China | 94.9 /100 | #121 | Exceptional 16.9% |
| Immigrants | Western Europe | 94.8 /100 | #122 | Exceptional 16.9% |
| Portuguese | 94.7 /100 | #123 | Exceptional 16.9% |
| Turks | 94.5 /100 | #124 | Exceptional 16.9% |
| Scandinavians | 94.1 /100 | #125 | Exceptional 16.9% |
| Europeans | 93.4 /100 | #126 | Exceptional 17.0% |
| Immigrants | Costa Rica | 93.1 /100 | #127 | Exceptional 17.0% |
| Nicaraguans | 93.0 /100 | #128 | Exceptional 17.0% |
| Immigrants | Uruguay | 92.9 /100 | #129 | Exceptional 17.0% |
| Immigrants | Vietnam | 92.4 /100 | #130 | Exceptional 17.0% |
| Immigrants | Germany | 92.1 /100 | #131 | Exceptional 17.0% |
Demographics Similar to Paraguayans by Cognitive Disability
In terms of cognitive disability, the demographic groups most similar to Paraguayans are Palestinian (16.8%, a difference of 0.0%), Immigrants from Eastern Asia (16.8%, a difference of 0.010%), Irish (16.8%, a difference of 0.050%), Northern European (16.8%, a difference of 0.050%), and Immigrants from Asia (16.8%, a difference of 0.070%).
| Demographics | Rating | Rank | Cognitive Disability |
| Finns | 98.5 /100 | #96 | Exceptional 16.8% |
| Dutch | 98.5 /100 | #97 | Exceptional 16.8% |
| Immigrants | Lebanon | 98.4 /100 | #98 | Exceptional 16.8% |
| Jordanians | 98.2 /100 | #99 | Exceptional 16.8% |
| Immigrants | Russia | 98.2 /100 | #100 | Exceptional 16.8% |
| Immigrants | Asia | 98.1 /100 | #101 | Exceptional 16.8% |
| Irish | 98.1 /100 | #102 | Exceptional 16.8% |
| Paraguayans | 98.0 /100 | #103 | Exceptional 16.8% |
| Palestinians | 98.0 /100 | #104 | Exceptional 16.8% |
| Immigrants | Eastern Asia | 97.9 /100 | #105 | Exceptional 16.8% |
| Northern Europeans | 97.8 /100 | #106 | Exceptional 16.8% |
| Immigrants | Nicaragua | 97.8 /100 | #107 | Exceptional 16.8% |
| Canadians | 97.5 /100 | #108 | Exceptional 16.8% |
| Albanians | 97.3 /100 | #109 | Exceptional 16.8% |
| Arapaho | 97.3 /100 | #110 | Exceptional 16.8% |