Carpatho Rusyn vs Belgian Male Disability
COMPARE
Carpatho Rusyn
Belgian
Male Disability
Male Disability Comparison
Carpatho Rusyns
Belgians
11.9%
MALE DISABILITY
1.3/ 100
METRIC RATING
237th/ 347
METRIC RANK
12.1%
MALE DISABILITY
0.3/ 100
METRIC RATING
259th/ 347
METRIC RANK
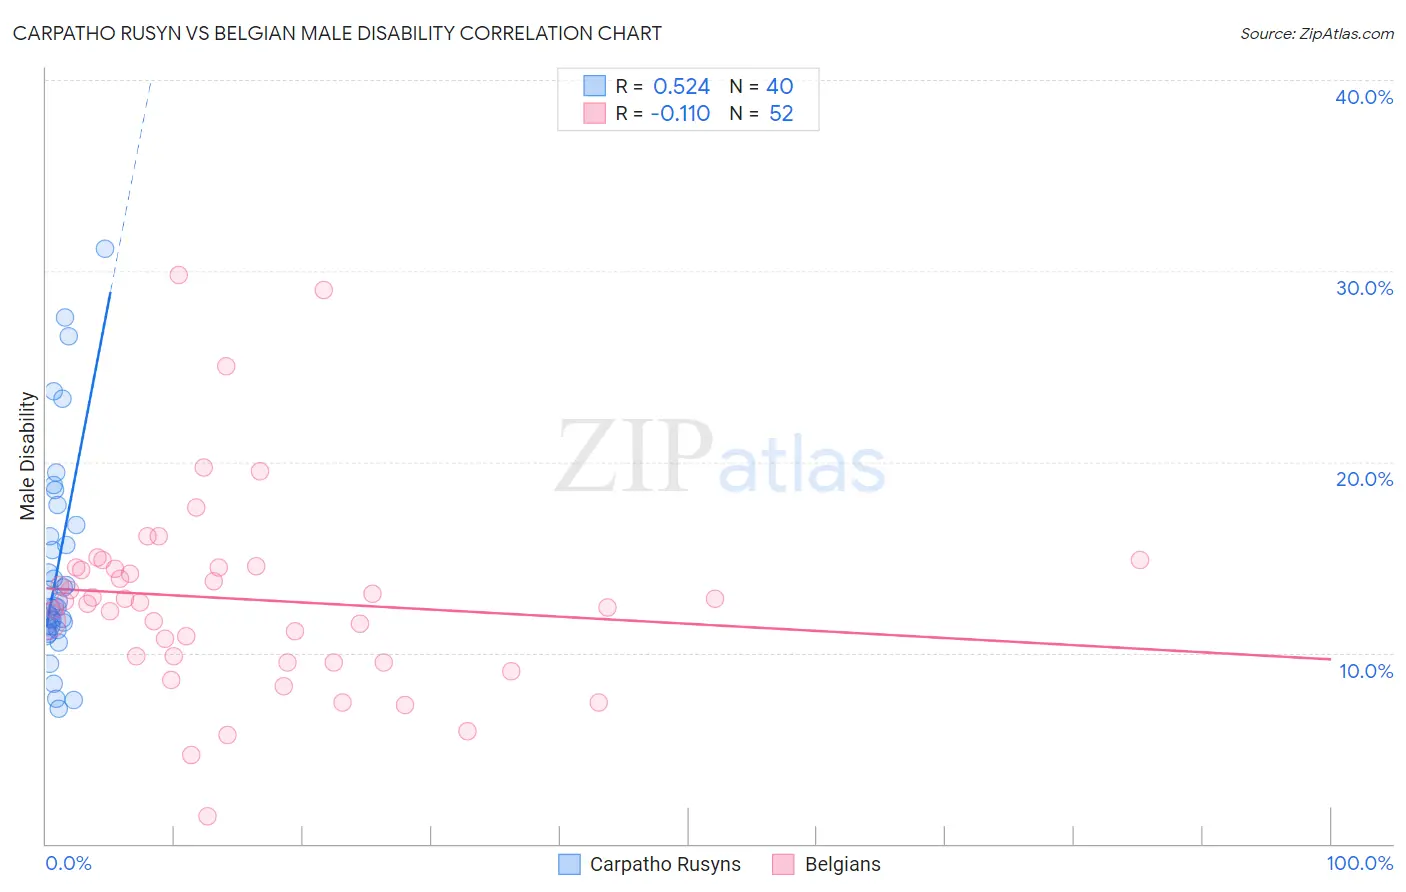
Carpatho Rusyn vs Belgian Male Disability Correlation Chart
The statistical analysis conducted on geographies consisting of 58,870,293 people shows a substantial positive correlation between the proportion of Carpatho Rusyns and percentage of males with a disability in the United States with a correlation coefficient (R) of 0.524 and weighted average of 11.9%. Similarly, the statistical analysis conducted on geographies consisting of 355,990,096 people shows a poor negative correlation between the proportion of Belgians and percentage of males with a disability in the United States with a correlation coefficient (R) of -0.110 and weighted average of 12.1%, a difference of 2.0%.
Male Disability Correlation Summary
| Measurement | Carpatho Rusyn | Belgian |
| Minimum | 7.0% | 1.4% |
| Maximum | 31.1% | 29.8% |
| Range | 24.1% | 28.3% |
| Mean | 14.4% | 12.8% |
| Median | 12.4% | 12.7% |
| Interquartile 25% (IQ1) | 11.3% | 9.7% |
| Interquartile 75% (IQ3) | 16.4% | 14.5% |
| Interquartile Range (IQR) | 5.1% | 4.8% |
| Standard Deviation (Sample) | 5.5% | 5.2% |
| Standard Deviation (Population) | 5.5% | 5.1% |
Similar Demographics by Male Disability
Demographics Similar to Carpatho Rusyns by Male Disability
In terms of male disability, the demographic groups most similar to Carpatho Rusyns are U.S. Virgin Islander (11.9%, a difference of 0.010%), Yugoslavian (11.9%, a difference of 0.10%), Immigrants from North America (11.9%, a difference of 0.15%), Italian (11.9%, a difference of 0.15%), and Czech (11.9%, a difference of 0.20%).
| Demographics | Rating | Rank | Male Disability |
| Croatians | 2.1 /100 | #230 | Tragic 11.8% |
| Dominicans | 1.8 /100 | #231 | Tragic 11.8% |
| Malaysians | 1.8 /100 | #232 | Tragic 11.8% |
| Mexicans | 1.7 /100 | #233 | Tragic 11.8% |
| Immigrants | Canada | 1.6 /100 | #234 | Tragic 11.9% |
| Immigrants | North America | 1.5 /100 | #235 | Tragic 11.9% |
| U.S. Virgin Islanders | 1.3 /100 | #236 | Tragic 11.9% |
| Carpatho Rusyns | 1.3 /100 | #237 | Tragic 11.9% |
| Yugoslavians | 1.2 /100 | #238 | Tragic 11.9% |
| Italians | 1.2 /100 | #239 | Tragic 11.9% |
| Czechs | 1.1 /100 | #240 | Tragic 11.9% |
| Bahamians | 1.1 /100 | #241 | Tragic 11.9% |
| Northern Europeans | 1.1 /100 | #242 | Tragic 11.9% |
| Samoans | 1.1 /100 | #243 | Tragic 11.9% |
| Immigrants | Laos | 1.0 /100 | #244 | Tragic 11.9% |
Demographics Similar to Belgians by Male Disability
In terms of male disability, the demographic groups most similar to Belgians are Basque (12.1%, a difference of 0.040%), Swedish (12.1%, a difference of 0.070%), Swiss (12.1%, a difference of 0.24%), European (12.1%, a difference of 0.24%), and Slavic (12.2%, a difference of 0.43%).
| Demographics | Rating | Rank | Male Disability |
| Slovenes | 0.5 /100 | #252 | Tragic 12.0% |
| Guamanians/Chamorros | 0.5 /100 | #253 | Tragic 12.0% |
| British | 0.4 /100 | #254 | Tragic 12.1% |
| Chinese | 0.4 /100 | #255 | Tragic 12.1% |
| Swiss | 0.3 /100 | #256 | Tragic 12.1% |
| Europeans | 0.3 /100 | #257 | Tragic 12.1% |
| Basques | 0.3 /100 | #258 | Tragic 12.1% |
| Belgians | 0.3 /100 | #259 | Tragic 12.1% |
| Swedes | 0.3 /100 | #260 | Tragic 12.1% |
| Slavs | 0.2 /100 | #261 | Tragic 12.2% |
| Norwegians | 0.2 /100 | #262 | Tragic 12.2% |
| Canadians | 0.2 /100 | #263 | Tragic 12.2% |
| Nepalese | 0.2 /100 | #264 | Tragic 12.2% |
| Immigrants | Portugal | 0.1 /100 | #265 | Tragic 12.3% |
| Hawaiians | 0.1 /100 | #266 | Tragic 12.3% |