Immigrants from Korea vs Iraqi Female Disability
COMPARE
Immigrants from Korea
Iraqi
Female Disability
Female Disability Comparison
Immigrants from Korea
Iraqis
10.6%
FEMALE DISABILITY
100.0/ 100
METRIC RATING
11th/ 347
METRIC RANK
12.3%
FEMALE DISABILITY
36.0/ 100
METRIC RATING
184th/ 347
METRIC RANK
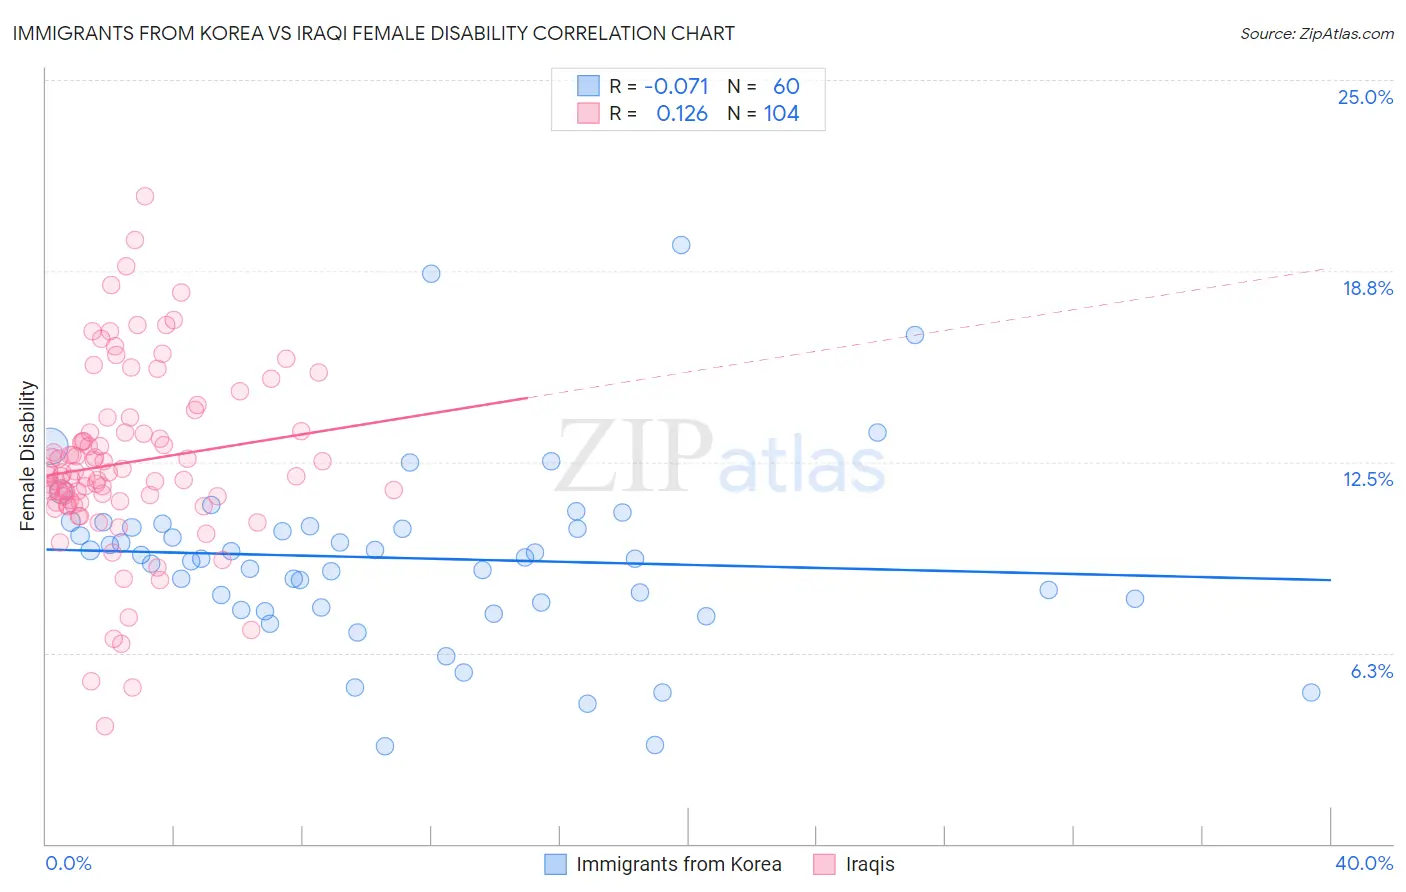
Immigrants from Korea vs Iraqi Female Disability Correlation Chart
The statistical analysis conducted on geographies consisting of 416,288,361 people shows a slight negative correlation between the proportion of Immigrants from Korea and percentage of females with a disability in the United States with a correlation coefficient (R) of -0.071 and weighted average of 10.6%. Similarly, the statistical analysis conducted on geographies consisting of 170,640,782 people shows a poor positive correlation between the proportion of Iraqis and percentage of females with a disability in the United States with a correlation coefficient (R) of 0.126 and weighted average of 12.3%, a difference of 15.3%.
Female Disability Correlation Summary
| Measurement | Immigrants from Korea | Iraqi |
| Minimum | 3.2% | 3.8% |
| Maximum | 19.6% | 21.2% |
| Range | 16.4% | 17.3% |
| Mean | 9.4% | 12.5% |
| Median | 9.3% | 12.1% |
| Interquartile 25% (IQ1) | 7.8% | 11.2% |
| Interquartile 75% (IQ3) | 10.4% | 13.5% |
| Interquartile Range (IQR) | 2.6% | 2.3% |
| Standard Deviation (Sample) | 3.0% | 3.0% |
| Standard Deviation (Population) | 3.0% | 2.9% |
Similar Demographics by Female Disability
Demographics Similar to Immigrants from Korea by Female Disability
In terms of female disability, the demographic groups most similar to Immigrants from Korea are Immigrants from Hong Kong (10.6%, a difference of 0.17%), Immigrants from Israel (10.7%, a difference of 0.42%), Immigrants from Eastern Asia (10.7%, a difference of 0.49%), Immigrants from China (10.7%, a difference of 0.52%), and Iranian (10.6%, a difference of 0.82%).
| Demographics | Rating | Rank | Female Disability |
| Thais | 100.0 /100 | #4 | Exceptional 10.2% |
| Immigrants | Bolivia | 100.0 /100 | #5 | Exceptional 10.3% |
| Bolivians | 100.0 /100 | #6 | Exceptional 10.4% |
| Immigrants | Singapore | 100.0 /100 | #7 | Exceptional 10.4% |
| Immigrants | South Central Asia | 100.0 /100 | #8 | Exceptional 10.5% |
| Iranians | 100.0 /100 | #9 | Exceptional 10.6% |
| Immigrants | Hong Kong | 100.0 /100 | #10 | Exceptional 10.6% |
| Immigrants | Korea | 100.0 /100 | #11 | Exceptional 10.6% |
| Immigrants | Israel | 100.0 /100 | #12 | Exceptional 10.7% |
| Immigrants | Eastern Asia | 100.0 /100 | #13 | Exceptional 10.7% |
| Immigrants | China | 100.0 /100 | #14 | Exceptional 10.7% |
| Burmese | 100.0 /100 | #15 | Exceptional 10.7% |
| Okinawans | 100.0 /100 | #16 | Exceptional 10.8% |
| Indians (Asian) | 100.0 /100 | #17 | Exceptional 10.8% |
| Immigrants | Iran | 100.0 /100 | #18 | Exceptional 10.8% |
Demographics Similar to Iraqis by Female Disability
In terms of female disability, the demographic groups most similar to Iraqis are Cuban (12.3%, a difference of 0.020%), Norwegian (12.3%, a difference of 0.040%), Immigrants from Canada (12.3%, a difference of 0.050%), Albanian (12.3%, a difference of 0.080%), and Immigrants from Uzbekistan (12.3%, a difference of 0.080%).
| Demographics | Rating | Rank | Female Disability |
| Immigrants | Ghana | 42.5 /100 | #177 | Average 12.2% |
| Immigrants | Western Europe | 40.9 /100 | #178 | Average 12.2% |
| Immigrants | Fiji | 38.2 /100 | #179 | Fair 12.3% |
| Albanians | 37.9 /100 | #180 | Fair 12.3% |
| Immigrants | Canada | 37.2 /100 | #181 | Fair 12.3% |
| Norwegians | 36.9 /100 | #182 | Fair 12.3% |
| Cubans | 36.5 /100 | #183 | Fair 12.3% |
| Iraqis | 36.0 /100 | #184 | Fair 12.3% |
| Immigrants | Uzbekistan | 33.9 /100 | #185 | Fair 12.3% |
| Austrians | 33.3 /100 | #186 | Fair 12.3% |
| Serbians | 33.1 /100 | #187 | Fair 12.3% |
| Immigrants | North America | 32.8 /100 | #188 | Fair 12.3% |
| Immigrants | Albania | 31.6 /100 | #189 | Fair 12.3% |
| Immigrants | Honduras | 31.3 /100 | #190 | Fair 12.3% |
| Armenians | 29.7 /100 | #191 | Fair 12.3% |