Romanian vs Immigrants from Morocco Vision Disability
COMPARE
Romanian
Immigrants from Morocco
Vision Disability
Vision Disability Comparison
Romanians
Immigrants from Morocco
2.1%
VISION DISABILITY
95.7/ 100
METRIC RATING
96th/ 347
METRIC RANK
2.1%
VISION DISABILITY
85.2/ 100
METRIC RATING
139th/ 347
METRIC RANK
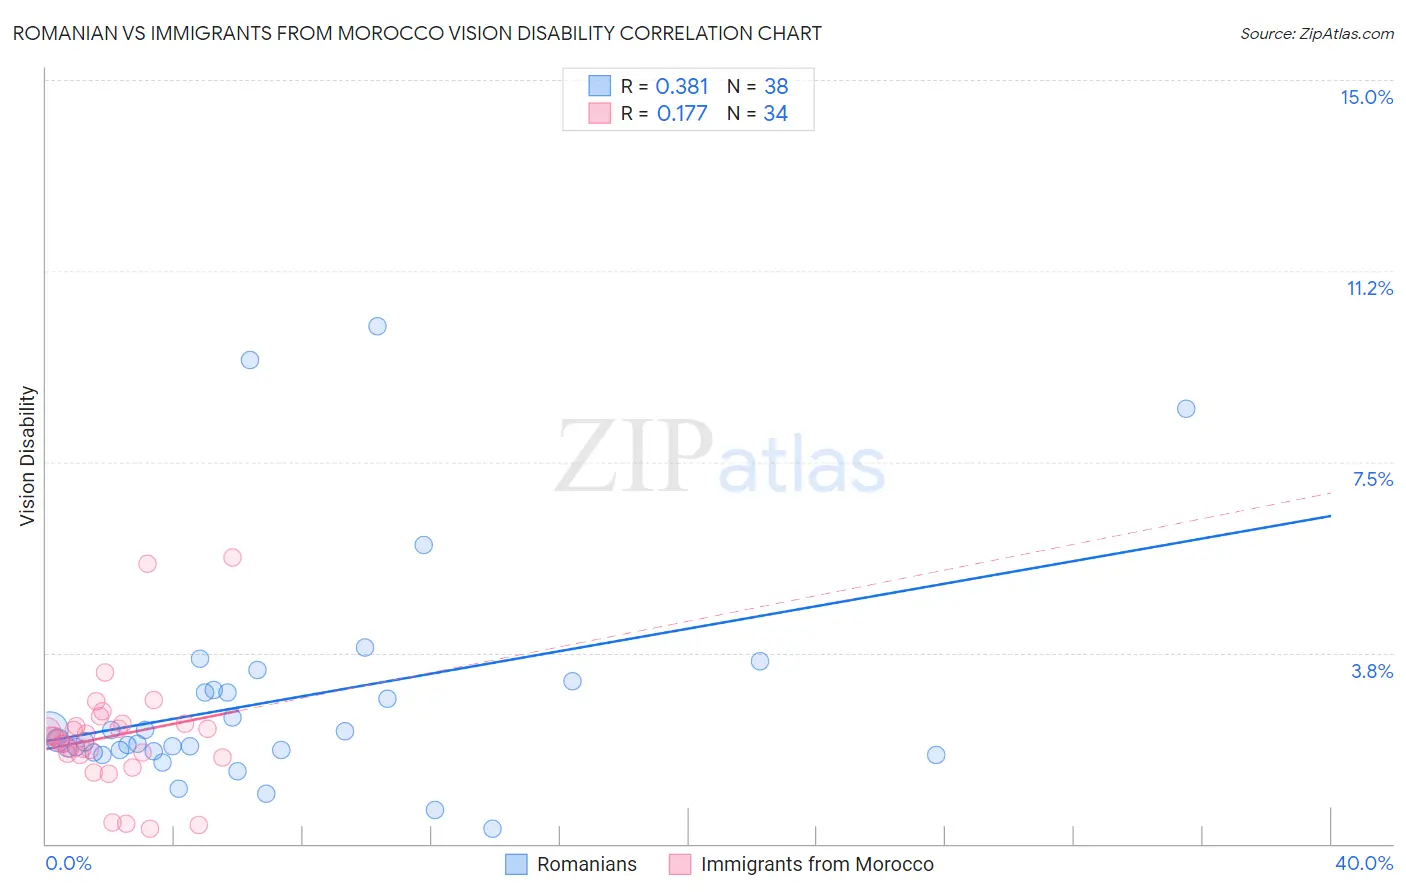
Romanian vs Immigrants from Morocco Vision Disability Correlation Chart
The statistical analysis conducted on geographies consisting of 377,620,863 people shows a mild positive correlation between the proportion of Romanians and percentage of population with vision disability in the United States with a correlation coefficient (R) of 0.381 and weighted average of 2.1%. Similarly, the statistical analysis conducted on geographies consisting of 178,891,599 people shows a poor positive correlation between the proportion of Immigrants from Morocco and percentage of population with vision disability in the United States with a correlation coefficient (R) of 0.177 and weighted average of 2.1%, a difference of 2.2%.
Vision Disability Correlation Summary
| Measurement | Romanian | Immigrants from Morocco |
| Minimum | 0.28% | 0.29% |
| Maximum | 10.2% | 5.6% |
| Range | 9.9% | 5.3% |
| Mean | 2.8% | 2.1% |
| Median | 2.0% | 2.1% |
| Interquartile 25% (IQ1) | 1.8% | 1.8% |
| Interquartile 75% (IQ3) | 3.0% | 2.4% |
| Interquartile Range (IQR) | 1.2% | 0.61% |
| Standard Deviation (Sample) | 2.2% | 1.1% |
| Standard Deviation (Population) | 2.2% | 1.1% |
Similar Demographics by Vision Disability
Demographics Similar to Romanians by Vision Disability
In terms of vision disability, the demographic groups most similar to Romanians are Australian (2.1%, a difference of 0.060%), Immigrants from Afghanistan (2.1%, a difference of 0.070%), Immigrants from South Africa (2.1%, a difference of 0.11%), Immigrants from Croatia (2.1%, a difference of 0.13%), and Immigrants from Europe (2.1%, a difference of 0.15%).
| Demographics | Rating | Rank | Vision Disability |
| Immigrants | Eastern Africa | 97.0 /100 | #89 | Exceptional 2.0% |
| Immigrants | Lebanon | 96.7 /100 | #90 | Exceptional 2.1% |
| Immigrants | Somalia | 96.2 /100 | #91 | Exceptional 2.1% |
| Immigrants | Syria | 96.2 /100 | #92 | Exceptional 2.1% |
| Immigrants | Europe | 96.1 /100 | #93 | Exceptional 2.1% |
| Immigrants | Croatia | 96.0 /100 | #94 | Exceptional 2.1% |
| Australians | 95.9 /100 | #95 | Exceptional 2.1% |
| Romanians | 95.7 /100 | #96 | Exceptional 2.1% |
| Immigrants | Afghanistan | 95.6 /100 | #97 | Exceptional 2.1% |
| Immigrants | South Africa | 95.4 /100 | #98 | Exceptional 2.1% |
| Estonians | 95.3 /100 | #99 | Exceptional 2.1% |
| Greeks | 95.1 /100 | #100 | Exceptional 2.1% |
| Albanians | 94.9 /100 | #101 | Exceptional 2.1% |
| Sri Lankans | 94.8 /100 | #102 | Exceptional 2.1% |
| Immigrants | Austria | 94.4 /100 | #103 | Exceptional 2.1% |
Demographics Similar to Immigrants from Morocco by Vision Disability
In terms of vision disability, the demographic groups most similar to Immigrants from Morocco are Immigrants from Netherlands (2.1%, a difference of 0.13%), Sierra Leonean (2.1%, a difference of 0.13%), Arab (2.1%, a difference of 0.14%), Czech (2.1%, a difference of 0.15%), and Immigrants from South Eastern Asia (2.1%, a difference of 0.15%).
| Demographics | Rating | Rank | Vision Disability |
| New Zealanders | 88.2 /100 | #132 | Excellent 2.1% |
| Syrians | 87.5 /100 | #133 | Excellent 2.1% |
| Venezuelans | 87.2 /100 | #134 | Excellent 2.1% |
| Vietnamese | 86.7 /100 | #135 | Excellent 2.1% |
| Czechs | 86.3 /100 | #136 | Excellent 2.1% |
| Immigrants | South Eastern Asia | 86.3 /100 | #137 | Excellent 2.1% |
| Arabs | 86.3 /100 | #138 | Excellent 2.1% |
| Immigrants | Morocco | 85.2 /100 | #139 | Excellent 2.1% |
| Immigrants | Netherlands | 84.2 /100 | #140 | Excellent 2.1% |
| Sierra Leoneans | 84.1 /100 | #141 | Excellent 2.1% |
| South Americans | 82.8 /100 | #142 | Excellent 2.1% |
| Immigrants | Sierra Leone | 82.8 /100 | #143 | Excellent 2.1% |
| Ukrainians | 81.9 /100 | #144 | Excellent 2.1% |
| Immigrants | Bosnia and Herzegovina | 81.5 /100 | #145 | Excellent 2.1% |
| Italians | 79.7 /100 | #146 | Good 2.1% |