Tsimshian vs Immigrants from Egypt Vision Disability
COMPARE
Tsimshian
Immigrants from Egypt
Vision Disability
Vision Disability Comparison
Tsimshian
Immigrants from Egypt
3.2%
VISION DISABILITY
0.0/ 100
METRIC RATING
339th/ 347
METRIC RANK
1.9%
VISION DISABILITY
99.9/ 100
METRIC RATING
33rd/ 347
METRIC RANK
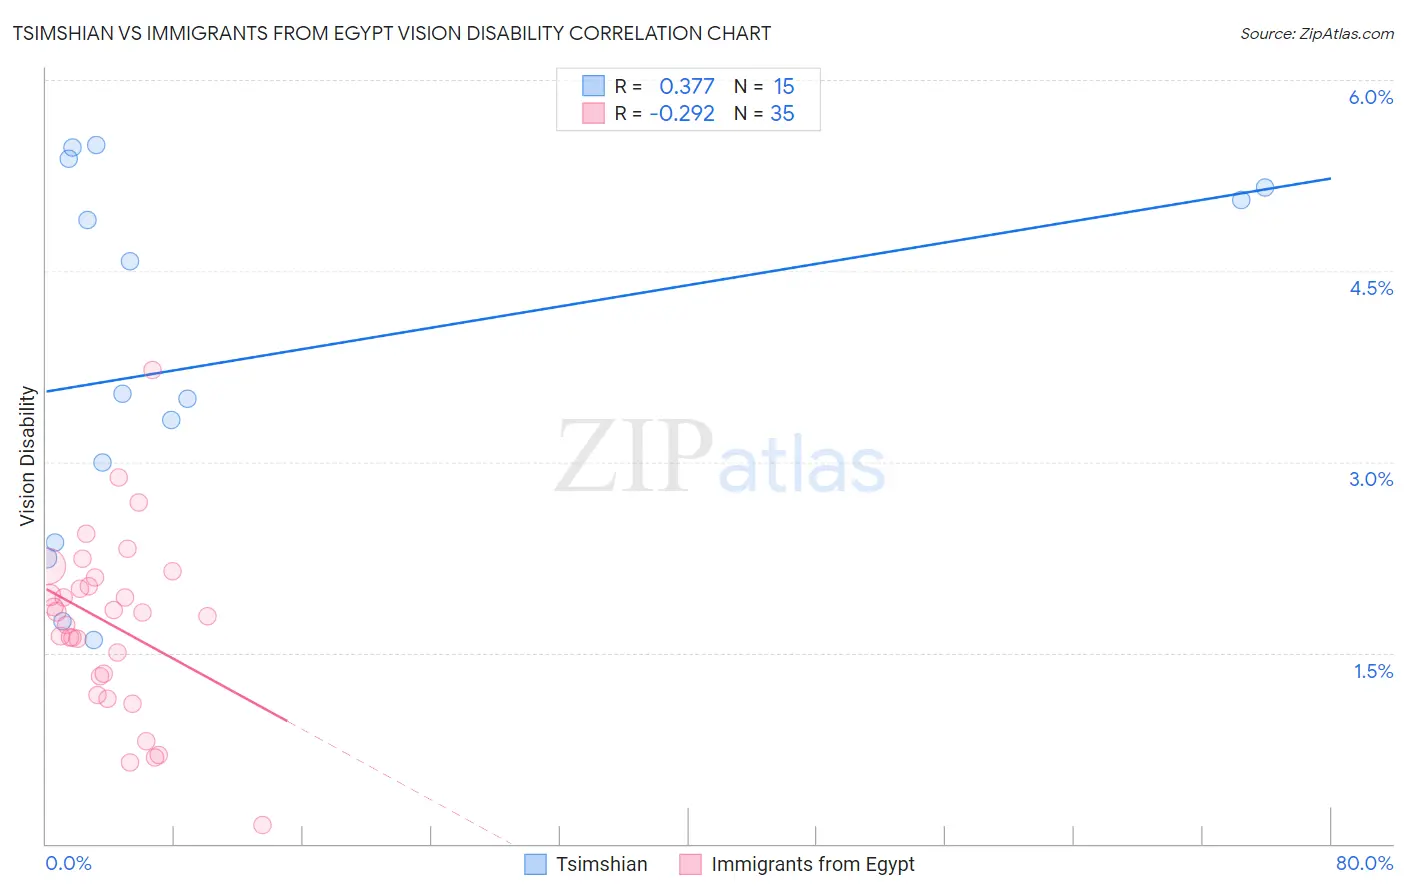
Tsimshian vs Immigrants from Egypt Vision Disability Correlation Chart
The statistical analysis conducted on geographies consisting of 15,626,544 people shows a mild positive correlation between the proportion of Tsimshian and percentage of population with vision disability in the United States with a correlation coefficient (R) of 0.377 and weighted average of 3.2%. Similarly, the statistical analysis conducted on geographies consisting of 245,409,407 people shows a weak negative correlation between the proportion of Immigrants from Egypt and percentage of population with vision disability in the United States with a correlation coefficient (R) of -0.292 and weighted average of 1.9%, a difference of 64.6%.
Vision Disability Correlation Summary
| Measurement | Tsimshian | Immigrants from Egypt |
| Minimum | 1.6% | 0.14% |
| Maximum | 5.5% | 3.7% |
| Range | 3.9% | 3.6% |
| Mean | 3.8% | 1.7% |
| Median | 3.5% | 1.8% |
| Interquartile 25% (IQ1) | 2.4% | 1.3% |
| Interquartile 75% (IQ3) | 5.2% | 2.1% |
| Interquartile Range (IQR) | 2.8% | 0.78% |
| Standard Deviation (Sample) | 1.4% | 0.69% |
| Standard Deviation (Population) | 1.4% | 0.68% |
Similar Demographics by Vision Disability
Demographics Similar to Tsimshian by Vision Disability
In terms of vision disability, the demographic groups most similar to Tsimshian are Creek (3.2%, a difference of 0.13%), Chickasaw (3.2%, a difference of 0.69%), Kiowa (3.3%, a difference of 1.6%), Dutch West Indian (3.2%, a difference of 1.6%), and Alaskan Athabascan (3.1%, a difference of 1.6%).
| Demographics | Rating | Rank | Vision Disability |
| Seminole | 0.0 /100 | #332 | Tragic 3.1% |
| Cajuns | 0.0 /100 | #333 | Tragic 3.1% |
| Cheyenne | 0.0 /100 | #334 | Tragic 3.1% |
| Navajo | 0.0 /100 | #335 | Tragic 3.1% |
| Alaskan Athabascans | 0.0 /100 | #336 | Tragic 3.1% |
| Dutch West Indians | 0.0 /100 | #337 | Tragic 3.2% |
| Chickasaw | 0.0 /100 | #338 | Tragic 3.2% |
| Tsimshian | 0.0 /100 | #339 | Tragic 3.2% |
| Creek | 0.0 /100 | #340 | Tragic 3.2% |
| Kiowa | 0.0 /100 | #341 | Tragic 3.3% |
| Choctaw | 0.0 /100 | #342 | Tragic 3.3% |
| Pima | 0.0 /100 | #343 | Tragic 3.3% |
| Pueblo | 0.0 /100 | #344 | Tragic 3.3% |
| Lumbee | 0.0 /100 | #345 | Tragic 3.4% |
| Houma | 0.0 /100 | #346 | Tragic 3.4% |
Demographics Similar to Immigrants from Egypt by Vision Disability
In terms of vision disability, the demographic groups most similar to Immigrants from Egypt are Immigrants from Turkey (1.9%, a difference of 0.13%), Immigrants from Australia (1.9%, a difference of 0.22%), Luxembourger (1.9%, a difference of 0.31%), Cambodian (2.0%, a difference of 0.57%), and Mongolian (1.9%, a difference of 0.58%).
| Demographics | Rating | Rank | Vision Disability |
| Immigrants | Japan | 99.9 /100 | #26 | Exceptional 1.9% |
| Taiwanese | 99.9 /100 | #27 | Exceptional 1.9% |
| Immigrants | Malaysia | 99.9 /100 | #28 | Exceptional 1.9% |
| Egyptians | 99.9 /100 | #29 | Exceptional 1.9% |
| Immigrants | Nepal | 99.9 /100 | #30 | Exceptional 1.9% |
| Mongolians | 99.9 /100 | #31 | Exceptional 1.9% |
| Luxembourgers | 99.9 /100 | #32 | Exceptional 1.9% |
| Immigrants | Egypt | 99.9 /100 | #33 | Exceptional 1.9% |
| Immigrants | Turkey | 99.8 /100 | #34 | Exceptional 1.9% |
| Immigrants | Australia | 99.8 /100 | #35 | Exceptional 1.9% |
| Cambodians | 99.8 /100 | #36 | Exceptional 2.0% |
| Bhutanese | 99.8 /100 | #37 | Exceptional 2.0% |
| Immigrants | Kuwait | 99.8 /100 | #38 | Exceptional 2.0% |
| Zimbabweans | 99.7 /100 | #39 | Exceptional 2.0% |
| Immigrants | Ireland | 99.7 /100 | #40 | Exceptional 2.0% |