Tsimshian vs Immigrants from Western Africa Vision Disability
COMPARE
Tsimshian
Immigrants from Western Africa
Vision Disability
Vision Disability Comparison
Tsimshian
Immigrants from Western Africa
3.2%
VISION DISABILITY
0.0/ 100
METRIC RATING
339th/ 347
METRIC RANK
2.3%
VISION DISABILITY
3.4/ 100
METRIC RATING
225th/ 347
METRIC RANK
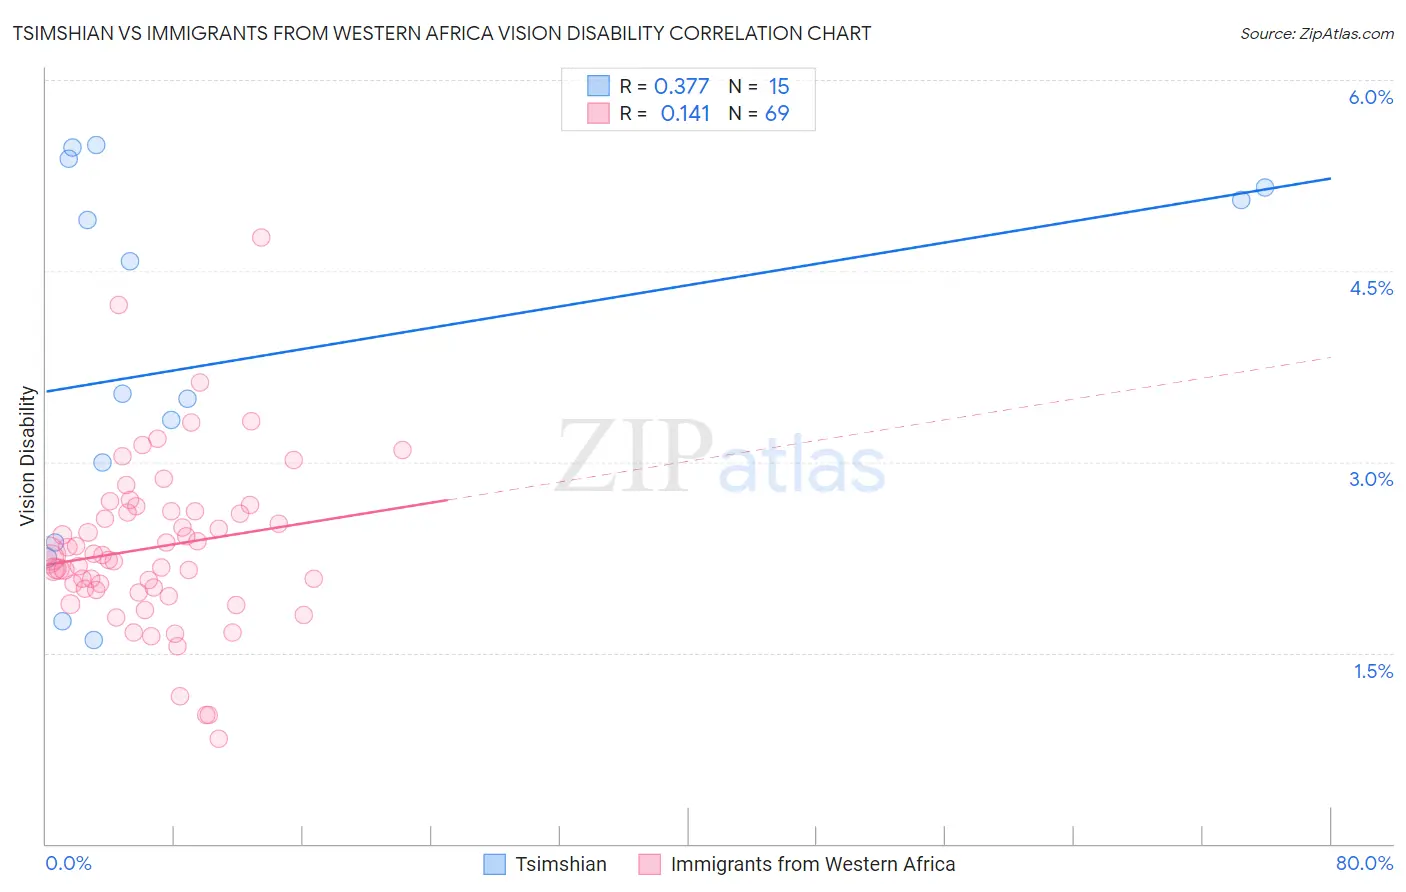
Tsimshian vs Immigrants from Western Africa Vision Disability Correlation Chart
The statistical analysis conducted on geographies consisting of 15,626,544 people shows a mild positive correlation between the proportion of Tsimshian and percentage of population with vision disability in the United States with a correlation coefficient (R) of 0.377 and weighted average of 3.2%. Similarly, the statistical analysis conducted on geographies consisting of 357,586,562 people shows a poor positive correlation between the proportion of Immigrants from Western Africa and percentage of population with vision disability in the United States with a correlation coefficient (R) of 0.141 and weighted average of 2.3%, a difference of 40.4%.
Vision Disability Correlation Summary
| Measurement | Tsimshian | Immigrants from Western Africa |
| Minimum | 1.6% | 0.83% |
| Maximum | 5.5% | 4.8% |
| Range | 3.9% | 3.9% |
| Mean | 3.8% | 2.3% |
| Median | 3.5% | 2.3% |
| Interquartile 25% (IQ1) | 2.4% | 2.0% |
| Interquartile 75% (IQ3) | 5.2% | 2.6% |
| Interquartile Range (IQR) | 2.8% | 0.61% |
| Standard Deviation (Sample) | 1.4% | 0.66% |
| Standard Deviation (Population) | 1.4% | 0.65% |
Similar Demographics by Vision Disability
Demographics Similar to Tsimshian by Vision Disability
In terms of vision disability, the demographic groups most similar to Tsimshian are Creek (3.2%, a difference of 0.13%), Chickasaw (3.2%, a difference of 0.69%), Kiowa (3.3%, a difference of 1.6%), Dutch West Indian (3.2%, a difference of 1.6%), and Alaskan Athabascan (3.1%, a difference of 1.6%).
| Demographics | Rating | Rank | Vision Disability |
| Seminole | 0.0 /100 | #332 | Tragic 3.1% |
| Cajuns | 0.0 /100 | #333 | Tragic 3.1% |
| Cheyenne | 0.0 /100 | #334 | Tragic 3.1% |
| Navajo | 0.0 /100 | #335 | Tragic 3.1% |
| Alaskan Athabascans | 0.0 /100 | #336 | Tragic 3.1% |
| Dutch West Indians | 0.0 /100 | #337 | Tragic 3.2% |
| Chickasaw | 0.0 /100 | #338 | Tragic 3.2% |
| Tsimshian | 0.0 /100 | #339 | Tragic 3.2% |
| Creek | 0.0 /100 | #340 | Tragic 3.2% |
| Kiowa | 0.0 /100 | #341 | Tragic 3.3% |
| Choctaw | 0.0 /100 | #342 | Tragic 3.3% |
| Pima | 0.0 /100 | #343 | Tragic 3.3% |
| Pueblo | 0.0 /100 | #344 | Tragic 3.3% |
| Lumbee | 0.0 /100 | #345 | Tragic 3.4% |
| Houma | 0.0 /100 | #346 | Tragic 3.4% |
Demographics Similar to Immigrants from Western Africa by Vision Disability
In terms of vision disability, the demographic groups most similar to Immigrants from Western Africa are Irish (2.3%, a difference of 0.010%), Basque (2.3%, a difference of 0.040%), Immigrants from Senegal (2.3%, a difference of 0.18%), French Canadian (2.3%, a difference of 0.20%), and Guamanian/Chamorro (2.3%, a difference of 0.22%).
| Demographics | Rating | Rank | Vision Disability |
| Portuguese | 4.9 /100 | #218 | Tragic 2.3% |
| Ecuadorians | 4.6 /100 | #219 | Tragic 2.3% |
| Guamanians/Chamorros | 3.9 /100 | #220 | Tragic 2.3% |
| French Canadians | 3.9 /100 | #221 | Tragic 2.3% |
| Immigrants | Senegal | 3.8 /100 | #222 | Tragic 2.3% |
| Basques | 3.5 /100 | #223 | Tragic 2.3% |
| Irish | 3.4 /100 | #224 | Tragic 2.3% |
| Immigrants | Western Africa | 3.4 /100 | #225 | Tragic 2.3% |
| Immigrants | Germany | 3.0 /100 | #226 | Tragic 2.3% |
| Hawaiians | 2.9 /100 | #227 | Tragic 2.3% |
| Hmong | 2.5 /100 | #228 | Tragic 2.3% |
| Welsh | 2.3 /100 | #229 | Tragic 2.3% |
| Nicaraguans | 2.2 /100 | #230 | Tragic 2.3% |
| Immigrants | Ecuador | 2.0 /100 | #231 | Tragic 2.3% |
| German Russians | 1.8 /100 | #232 | Tragic 2.3% |