Tsimshian vs Black/African American Disability Age Over 75
COMPARE
Tsimshian
Black/African American
Disability Age Over 75
Disability Age Over 75 Comparison
Tsimshian
Blacks/African Americans
59.2%
DISABILITY AGE OVER 75
0.0/ 100
METRIC RATING
346th/ 347
METRIC RANK
49.5%
DISABILITY AGE OVER 75
0.0/ 100
METRIC RATING
282nd/ 347
METRIC RANK
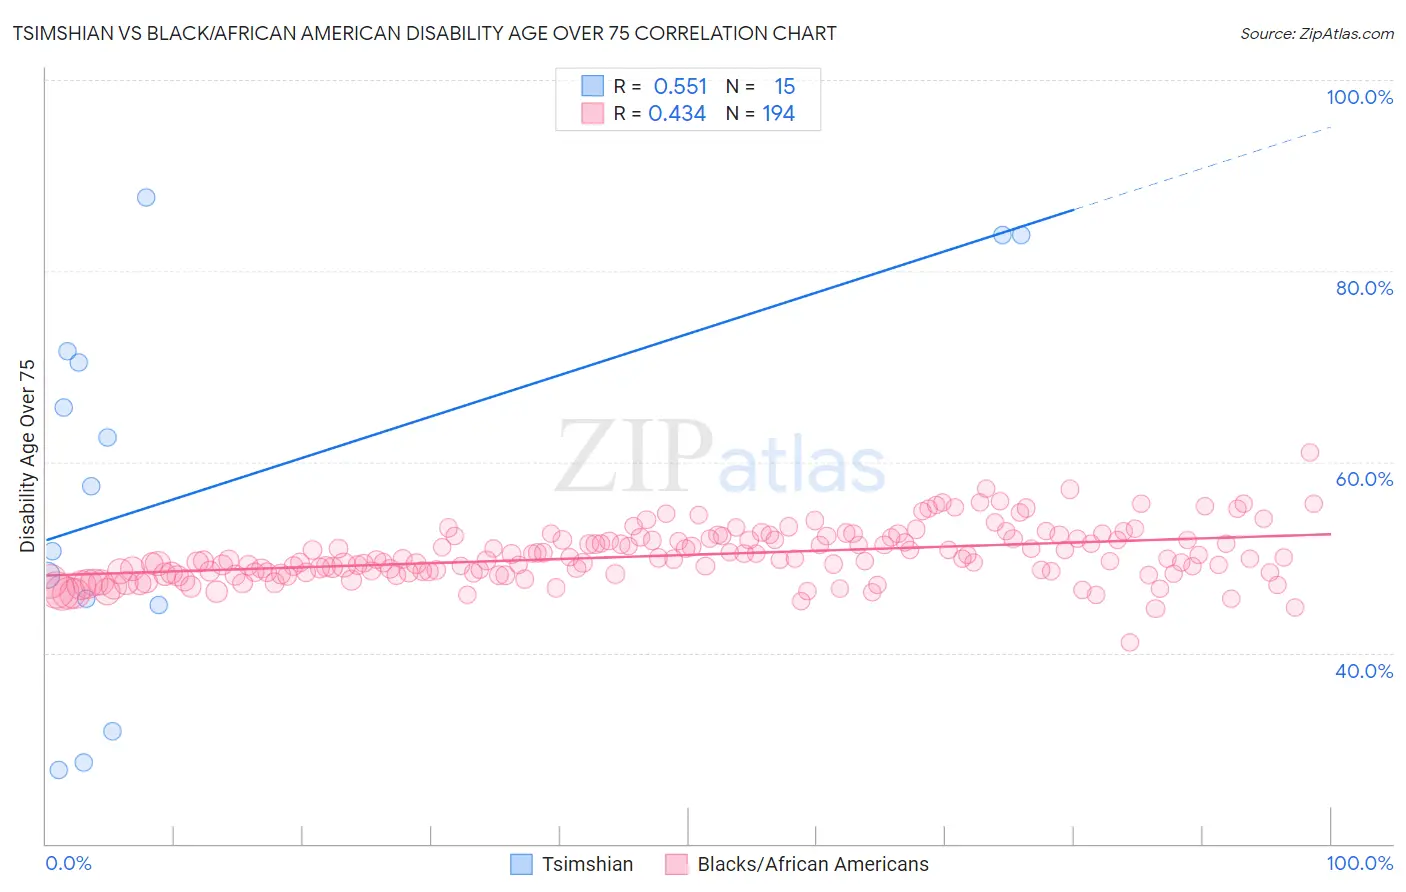
Tsimshian vs Black/African American Disability Age Over 75 Correlation Chart
The statistical analysis conducted on geographies consisting of 15,620,176 people shows a substantial positive correlation between the proportion of Tsimshian and percentage of population with a disability over the age of 75 in the United States with a correlation coefficient (R) of 0.551 and weighted average of 59.2%. Similarly, the statistical analysis conducted on geographies consisting of 563,629,175 people shows a moderate positive correlation between the proportion of Blacks/African Americans and percentage of population with a disability over the age of 75 in the United States with a correlation coefficient (R) of 0.434 and weighted average of 49.5%, a difference of 19.6%.
Disability Age Over 75 Correlation Summary
| Measurement | Tsimshian | Black/African American |
| Minimum | 27.7% | 41.1% |
| Maximum | 87.8% | 61.0% |
| Range | 60.1% | 19.9% |
| Mean | 57.4% | 50.2% |
| Median | 57.4% | 49.8% |
| Interquartile 25% (IQ1) | 45.0% | 48.4% |
| Interquartile 75% (IQ3) | 71.6% | 52.0% |
| Interquartile Range (IQR) | 26.6% | 3.6% |
| Standard Deviation (Sample) | 20.0% | 2.8% |
| Standard Deviation (Population) | 19.3% | 2.8% |
Similar Demographics by Disability Age Over 75
Demographics Similar to Tsimshian by Disability Age Over 75
In terms of disability age over 75, the demographic groups most similar to Tsimshian are Inupiat (58.4%, a difference of 1.4%), Navajo (58.3%, a difference of 1.6%), Yup'ik (61.1%, a difference of 3.2%), Tohono O'odham (56.7%, a difference of 4.4%), and Lumbee (56.2%, a difference of 5.3%).
| Demographics | Rating | Rank | Disability Age Over 75 |
| Apache | 0.0 /100 | #333 | Tragic 53.6% |
| Alaskan Athabascans | 0.0 /100 | #334 | Tragic 54.0% |
| Kiowa | 0.0 /100 | #335 | Tragic 54.2% |
| Immigrants | Armenia | 0.0 /100 | #336 | Tragic 54.3% |
| Yuman | 0.0 /100 | #337 | Tragic 54.4% |
| Colville | 0.0 /100 | #338 | Tragic 55.4% |
| Pima | 0.0 /100 | #339 | Tragic 55.8% |
| Pueblo | 0.0 /100 | #340 | Tragic 55.9% |
| Houma | 0.0 /100 | #341 | Tragic 56.2% |
| Lumbee | 0.0 /100 | #342 | Tragic 56.2% |
| Tohono O'odham | 0.0 /100 | #343 | Tragic 56.7% |
| Navajo | 0.0 /100 | #344 | Tragic 58.3% |
| Inupiat | 0.0 /100 | #345 | Tragic 58.4% |
| Tsimshian | 0.0 /100 | #346 | Tragic 59.2% |
| Yup'ik | 0.0 /100 | #347 | Tragic 61.1% |
Demographics Similar to Blacks/African Americans by Disability Age Over 75
In terms of disability age over 75, the demographic groups most similar to Blacks/African Americans are Samoan (49.5%, a difference of 0.030%), Immigrants from Latin America (49.5%, a difference of 0.080%), Belizean (49.4%, a difference of 0.14%), Bangladeshi (49.4%, a difference of 0.15%), and Guamanian/Chamorro (49.4%, a difference of 0.21%).
| Demographics | Rating | Rank | Disability Age Over 75 |
| Immigrants | Dominica | 0.1 /100 | #275 | Tragic 49.1% |
| Immigrants | Uzbekistan | 0.1 /100 | #276 | Tragic 49.2% |
| Hawaiians | 0.1 /100 | #277 | Tragic 49.2% |
| Immigrants | Laos | 0.1 /100 | #278 | Tragic 49.2% |
| Guamanians/Chamorros | 0.0 /100 | #279 | Tragic 49.4% |
| Bangladeshis | 0.0 /100 | #280 | Tragic 49.4% |
| Belizeans | 0.0 /100 | #281 | Tragic 49.4% |
| Blacks/African Americans | 0.0 /100 | #282 | Tragic 49.5% |
| Samoans | 0.0 /100 | #283 | Tragic 49.5% |
| Immigrants | Latin America | 0.0 /100 | #284 | Tragic 49.5% |
| Crow | 0.0 /100 | #285 | Tragic 49.6% |
| Immigrants | Belize | 0.0 /100 | #286 | Tragic 49.6% |
| Sioux | 0.0 /100 | #287 | Tragic 49.7% |
| Yaqui | 0.0 /100 | #288 | Tragic 49.8% |
| Osage | 0.0 /100 | #289 | Tragic 49.8% |