Tsimshian vs Black/African American Unemployment Among Ages 20 to 24 years
COMPARE
Tsimshian
Black/African American
Unemployment Among Ages 20 to 24 years
Unemployment Among Ages 20 to 24 years Comparison
Tsimshian
Blacks/African Americans
18.0%
UNEMPLOYMENT AMONG AGES 20 TO 24 YEARS
0.0/ 100
METRIC RATING
343rd/ 347
METRIC RANK
12.7%
UNEMPLOYMENT AMONG AGES 20 TO 24 YEARS
0.0/ 100
METRIC RATING
314th/ 347
METRIC RANK
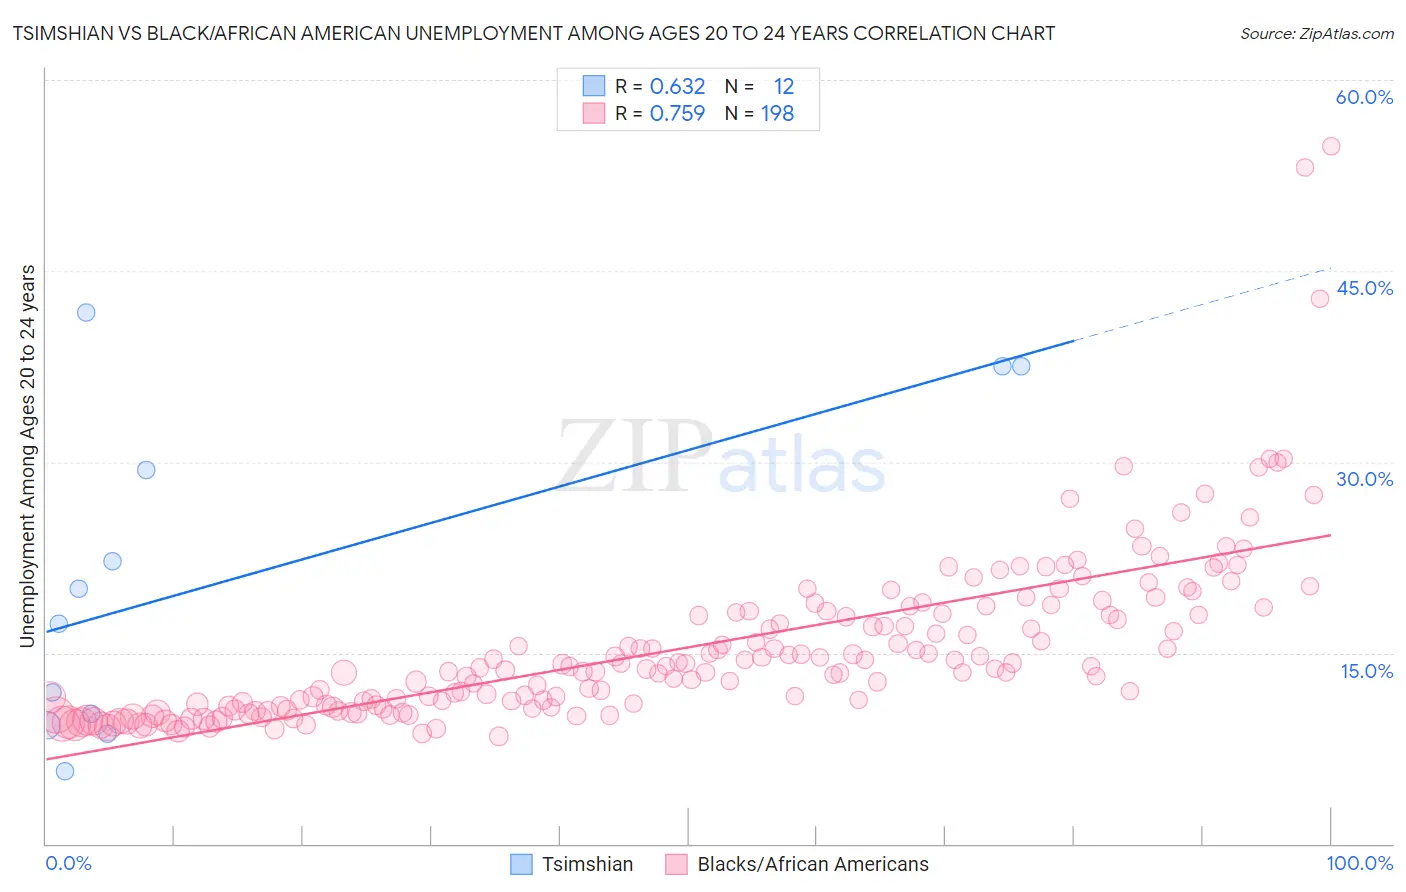
Tsimshian vs Black/African American Unemployment Among Ages 20 to 24 years Correlation Chart
The statistical analysis conducted on geographies consisting of 15,555,323 people shows a significant positive correlation between the proportion of Tsimshian and unemployment rate among population between the ages 20 and 24 in the United States with a correlation coefficient (R) of 0.632 and weighted average of 18.0%. Similarly, the statistical analysis conducted on geographies consisting of 523,414,021 people shows a strong positive correlation between the proportion of Blacks/African Americans and unemployment rate among population between the ages 20 and 24 in the United States with a correlation coefficient (R) of 0.759 and weighted average of 12.7%, a difference of 41.2%.
Unemployment Among Ages 20 to 24 years Correlation Summary
| Measurement | Tsimshian | Black/African American |
| Minimum | 5.7% | 8.4% |
| Maximum | 41.7% | 54.7% |
| Range | 36.0% | 46.3% |
| Mean | 20.9% | 15.4% |
| Median | 18.6% | 13.7% |
| Interquartile 25% (IQ1) | 9.8% | 10.7% |
| Interquartile 75% (IQ3) | 33.5% | 18.1% |
| Interquartile Range (IQR) | 23.7% | 7.4% |
| Standard Deviation (Sample) | 12.7% | 6.7% |
| Standard Deviation (Population) | 12.2% | 6.6% |
Similar Demographics by Unemployment Among Ages 20 to 24 years
Demographics Similar to Tsimshian by Unemployment Among Ages 20 to 24 years
In terms of unemployment among ages 20 to 24 years, the demographic groups most similar to Tsimshian are Crow (18.7%, a difference of 4.2%), Puerto Rican (16.7%, a difference of 8.0%), Hopi (19.9%, a difference of 10.6%), Navajo (16.1%, a difference of 11.4%), and Yuman (15.8%, a difference of 13.5%).
| Demographics | Rating | Rank | Unemployment Among Ages 20 to 24 years |
| Immigrants | Guyana | 0.0 /100 | #333 | Tragic 13.9% |
| Guyanese | 0.0 /100 | #334 | Tragic 14.0% |
| Sioux | 0.0 /100 | #335 | Tragic 14.2% |
| Pima | 0.0 /100 | #336 | Tragic 14.2% |
| Paiute | 0.0 /100 | #337 | Tragic 14.3% |
| Immigrants | St. Vincent and the Grenadines | 0.0 /100 | #338 | Tragic 14.3% |
| Immigrants | Yemen | 0.0 /100 | #339 | Tragic 14.9% |
| Yuman | 0.0 /100 | #340 | Tragic 15.8% |
| Navajo | 0.0 /100 | #341 | Tragic 16.1% |
| Puerto Ricans | 0.0 /100 | #342 | Tragic 16.7% |
| Tsimshian | 0.0 /100 | #343 | Tragic 18.0% |
| Crow | 0.0 /100 | #344 | Tragic 18.7% |
| Hopi | 0.0 /100 | #345 | Tragic 19.9% |
| Yup'ik | 0.0 /100 | #346 | Tragic 20.9% |
| Inupiat | 0.0 /100 | #347 | Tragic 20.9% |
Demographics Similar to Blacks/African Americans by Unemployment Among Ages 20 to 24 years
In terms of unemployment among ages 20 to 24 years, the demographic groups most similar to Blacks/African Americans are Shoshone (12.7%, a difference of 0.19%), West Indian (12.8%, a difference of 0.21%), Immigrants from Dominica (12.8%, a difference of 0.68%), Houma (12.6%, a difference of 0.73%), and Immigrants from Trinidad and Tobago (12.8%, a difference of 0.80%).
| Demographics | Rating | Rank | Unemployment Among Ages 20 to 24 years |
| Bermudans | 0.0 /100 | #307 | Tragic 12.5% |
| Tohono O'odham | 0.0 /100 | #308 | Tragic 12.5% |
| Immigrants | Bangladesh | 0.0 /100 | #309 | Tragic 12.6% |
| Jamaicans | 0.0 /100 | #310 | Tragic 12.6% |
| Vietnamese | 0.0 /100 | #311 | Tragic 12.6% |
| Houma | 0.0 /100 | #312 | Tragic 12.6% |
| Shoshone | 0.0 /100 | #313 | Tragic 12.7% |
| Blacks/African Americans | 0.0 /100 | #314 | Tragic 12.7% |
| West Indians | 0.0 /100 | #315 | Tragic 12.8% |
| Immigrants | Dominica | 0.0 /100 | #316 | Tragic 12.8% |
| Immigrants | Trinidad and Tobago | 0.0 /100 | #317 | Tragic 12.8% |
| Barbadians | 0.0 /100 | #318 | Tragic 12.9% |
| Trinidadians and Tobagonians | 0.0 /100 | #319 | Tragic 12.9% |
| Cheyenne | 0.0 /100 | #320 | Tragic 13.0% |
| Immigrants | Jamaica | 0.0 /100 | #321 | Tragic 13.0% |