Immigrants from South Africa vs Black/African American Disability Age Over 75
COMPARE
Immigrants from South Africa
Black/African American
Disability Age Over 75
Disability Age Over 75 Comparison
Immigrants from South Africa
Blacks/African Americans
45.3%
DISABILITY AGE OVER 75
100.0/ 100
METRIC RATING
22nd/ 347
METRIC RANK
49.5%
DISABILITY AGE OVER 75
0.0/ 100
METRIC RATING
282nd/ 347
METRIC RANK
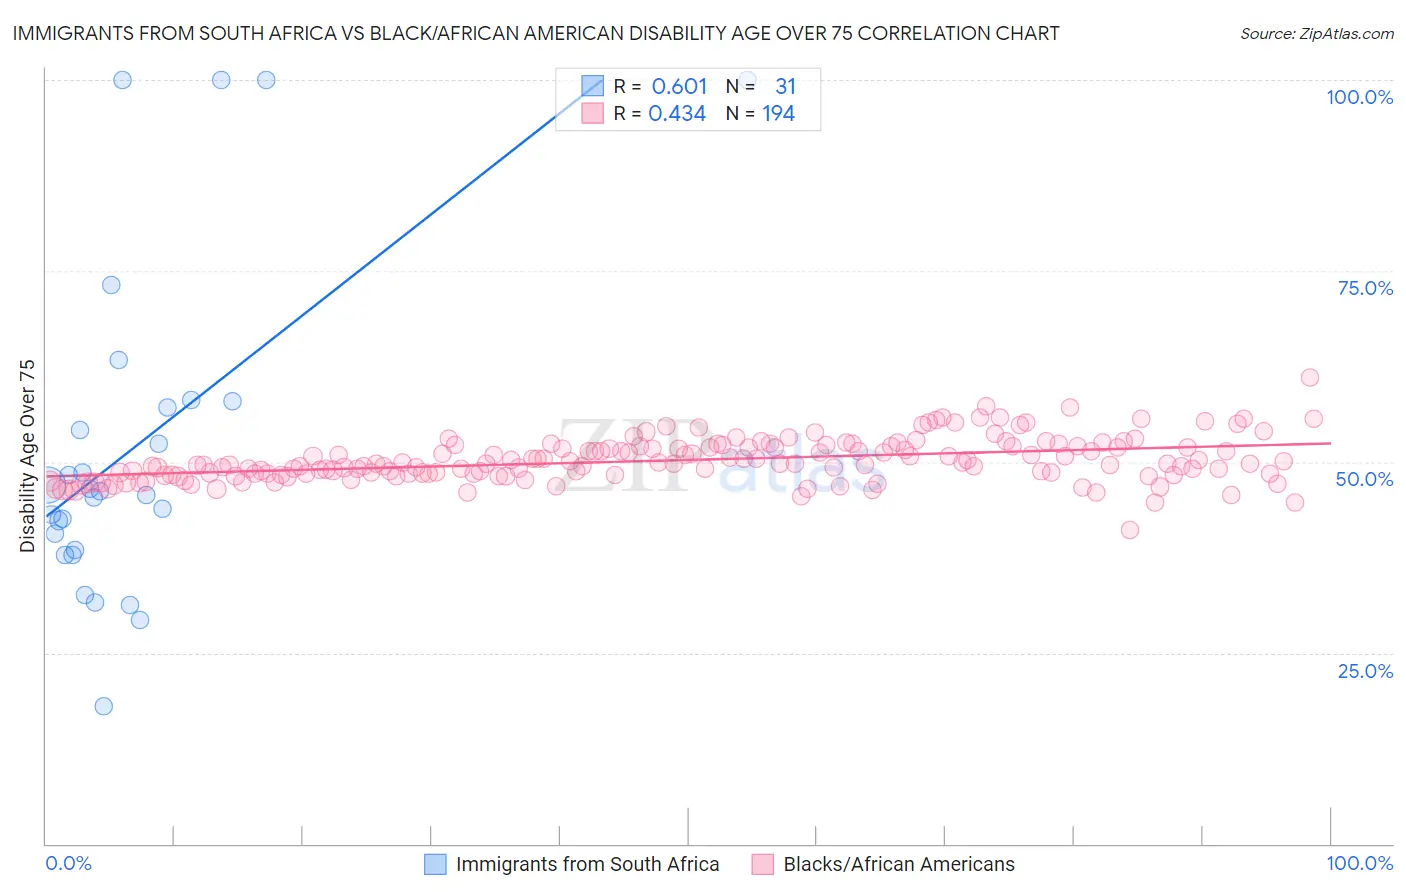
Immigrants from South Africa vs Black/African American Disability Age Over 75 Correlation Chart
The statistical analysis conducted on geographies consisting of 233,155,609 people shows a significant positive correlation between the proportion of Immigrants from South Africa and percentage of population with a disability over the age of 75 in the United States with a correlation coefficient (R) of 0.601 and weighted average of 45.3%. Similarly, the statistical analysis conducted on geographies consisting of 563,629,175 people shows a moderate positive correlation between the proportion of Blacks/African Americans and percentage of population with a disability over the age of 75 in the United States with a correlation coefficient (R) of 0.434 and weighted average of 49.5%, a difference of 9.2%.
Disability Age Over 75 Correlation Summary
| Measurement | Immigrants from South Africa | Black/African American |
| Minimum | 18.0% | 41.1% |
| Maximum | 100.0% | 61.0% |
| Range | 82.0% | 19.9% |
| Mean | 52.0% | 50.2% |
| Median | 46.2% | 49.8% |
| Interquartile 25% (IQ1) | 38.5% | 48.4% |
| Interquartile 75% (IQ3) | 57.9% | 52.0% |
| Interquartile Range (IQR) | 19.4% | 3.6% |
| Standard Deviation (Sample) | 21.6% | 2.8% |
| Standard Deviation (Population) | 21.3% | 2.8% |
Similar Demographics by Disability Age Over 75
Demographics Similar to Immigrants from South Africa by Disability Age Over 75
In terms of disability age over 75, the demographic groups most similar to Immigrants from South Africa are Immigrants from Belgium (45.3%, a difference of 0.030%), Immigrants from Switzerland (45.3%, a difference of 0.030%), Polish (45.3%, a difference of 0.050%), Immigrants from Bolivia (45.4%, a difference of 0.10%), and Macedonian (45.4%, a difference of 0.13%).
| Demographics | Rating | Rank | Disability Age Over 75 |
| Immigrants | Sweden | 100.0 /100 | #15 | Exceptional 45.1% |
| Immigrants | Northern Europe | 100.0 /100 | #16 | Exceptional 45.2% |
| Immigrants | India | 100.0 /100 | #17 | Exceptional 45.2% |
| Bolivians | 100.0 /100 | #18 | Exceptional 45.2% |
| Immigrants | Greece | 100.0 /100 | #19 | Exceptional 45.2% |
| Immigrants | Serbia | 100.0 /100 | #20 | Exceptional 45.3% |
| Immigrants | Belgium | 100.0 /100 | #21 | Exceptional 45.3% |
| Immigrants | South Africa | 100.0 /100 | #22 | Exceptional 45.3% |
| Immigrants | Switzerland | 99.9 /100 | #23 | Exceptional 45.3% |
| Poles | 99.9 /100 | #24 | Exceptional 45.3% |
| Immigrants | Bolivia | 99.9 /100 | #25 | Exceptional 45.4% |
| Macedonians | 99.9 /100 | #26 | Exceptional 45.4% |
| Immigrants | Poland | 99.9 /100 | #27 | Exceptional 45.4% |
| Thais | 99.9 /100 | #28 | Exceptional 45.4% |
| Filipinos | 99.9 /100 | #29 | Exceptional 45.4% |
Demographics Similar to Blacks/African Americans by Disability Age Over 75
In terms of disability age over 75, the demographic groups most similar to Blacks/African Americans are Samoan (49.5%, a difference of 0.030%), Immigrants from Latin America (49.5%, a difference of 0.080%), Belizean (49.4%, a difference of 0.14%), Bangladeshi (49.4%, a difference of 0.15%), and Guamanian/Chamorro (49.4%, a difference of 0.21%).
| Demographics | Rating | Rank | Disability Age Over 75 |
| Immigrants | Dominica | 0.1 /100 | #275 | Tragic 49.1% |
| Immigrants | Uzbekistan | 0.1 /100 | #276 | Tragic 49.2% |
| Hawaiians | 0.1 /100 | #277 | Tragic 49.2% |
| Immigrants | Laos | 0.1 /100 | #278 | Tragic 49.2% |
| Guamanians/Chamorros | 0.0 /100 | #279 | Tragic 49.4% |
| Bangladeshis | 0.0 /100 | #280 | Tragic 49.4% |
| Belizeans | 0.0 /100 | #281 | Tragic 49.4% |
| Blacks/African Americans | 0.0 /100 | #282 | Tragic 49.5% |
| Samoans | 0.0 /100 | #283 | Tragic 49.5% |
| Immigrants | Latin America | 0.0 /100 | #284 | Tragic 49.5% |
| Crow | 0.0 /100 | #285 | Tragic 49.6% |
| Immigrants | Belize | 0.0 /100 | #286 | Tragic 49.6% |
| Sioux | 0.0 /100 | #287 | Tragic 49.7% |
| Yaqui | 0.0 /100 | #288 | Tragic 49.8% |
| Osage | 0.0 /100 | #289 | Tragic 49.8% |