Trinidadian and Tobagonian vs Native Hawaiian Vision Disability
COMPARE
Trinidadian and Tobagonian
Native Hawaiian
Vision Disability
Vision Disability Comparison
Trinidadians and Tobagonians
Native Hawaiians
2.2%
VISION DISABILITY
8.2/ 100
METRIC RATING
214th/ 347
METRIC RANK
2.2%
VISION DISABILITY
33.3/ 100
METRIC RATING
186th/ 347
METRIC RANK
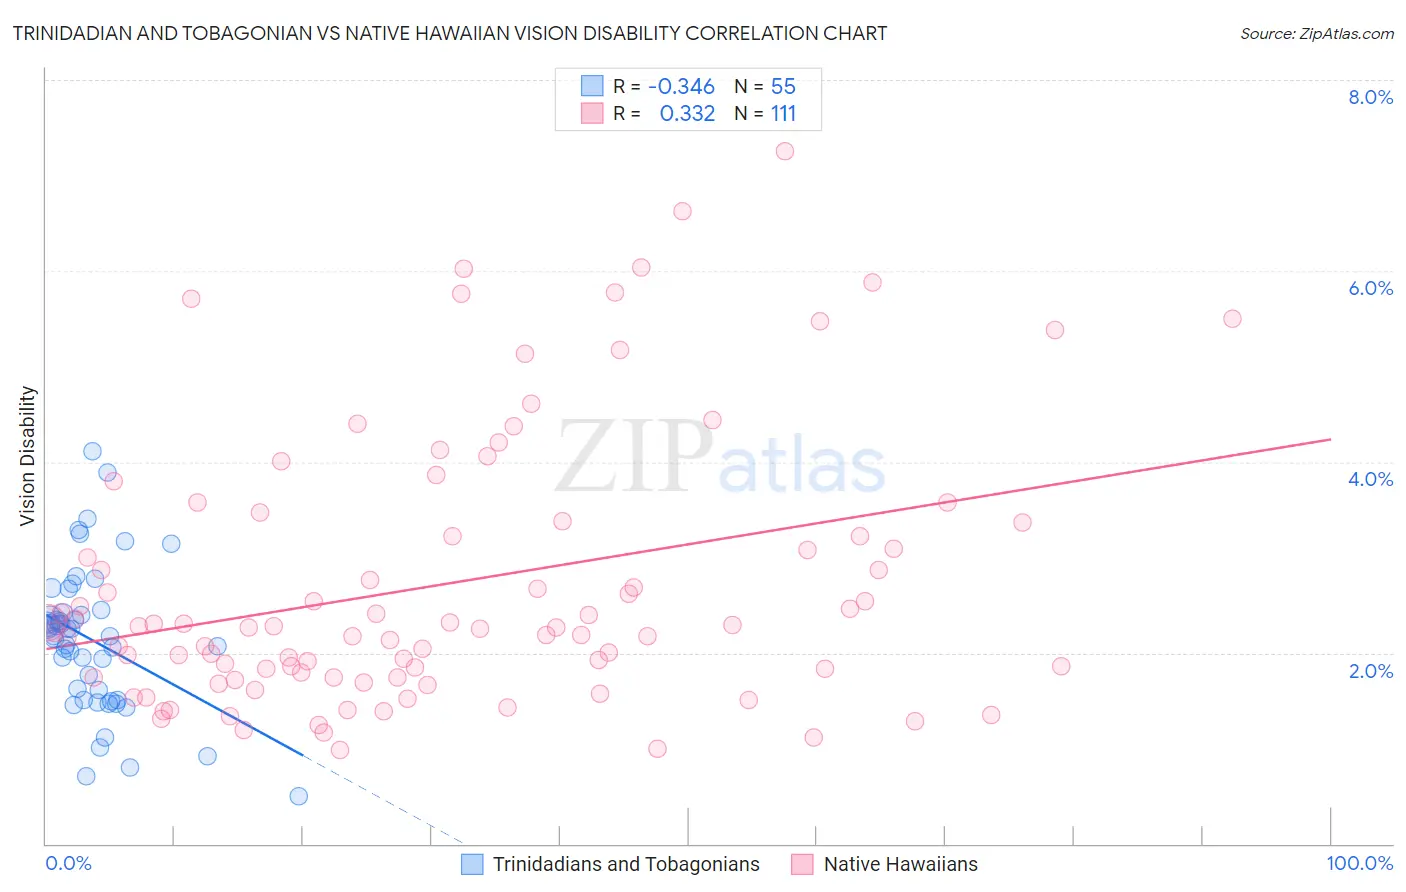
Trinidadian and Tobagonian vs Native Hawaiian Vision Disability Correlation Chart
The statistical analysis conducted on geographies consisting of 219,745,653 people shows a mild negative correlation between the proportion of Trinidadians and Tobagonians and percentage of population with vision disability in the United States with a correlation coefficient (R) of -0.346 and weighted average of 2.2%. Similarly, the statistical analysis conducted on geographies consisting of 331,807,196 people shows a mild positive correlation between the proportion of Native Hawaiians and percentage of population with vision disability in the United States with a correlation coefficient (R) of 0.332 and weighted average of 2.2%, a difference of 2.7%.
Vision Disability Correlation Summary
| Measurement | Trinidadian and Tobagonian | Native Hawaiian |
| Minimum | 0.49% | 0.98% |
| Maximum | 4.1% | 7.3% |
| Range | 3.6% | 6.3% |
| Mean | 2.1% | 2.7% |
| Median | 2.2% | 2.3% |
| Interquartile 25% (IQ1) | 1.5% | 1.7% |
| Interquartile 75% (IQ3) | 2.4% | 3.4% |
| Interquartile Range (IQR) | 0.92% | 1.6% |
| Standard Deviation (Sample) | 0.75% | 1.4% |
| Standard Deviation (Population) | 0.74% | 1.4% |
Similar Demographics by Vision Disability
Demographics Similar to Trinidadians and Tobagonians by Vision Disability
In terms of vision disability, the demographic groups most similar to Trinidadians and Tobagonians are Immigrants from Ghana (2.2%, a difference of 0.13%), Bermudan (2.2%, a difference of 0.14%), Nigerian (2.3%, a difference of 0.21%), Indonesian (2.2%, a difference of 0.23%), and Immigrants from Trinidad and Tobago (2.3%, a difference of 0.50%).
| Demographics | Rating | Rank | Vision Disability |
| Immigrants | Nigeria | 13.5 /100 | #207 | Poor 2.2% |
| Germans | 13.4 /100 | #208 | Poor 2.2% |
| Immigrants | Brazil | 13.1 /100 | #209 | Poor 2.2% |
| Immigrants | Uruguay | 11.5 /100 | #210 | Poor 2.2% |
| Indonesians | 9.5 /100 | #211 | Tragic 2.2% |
| Bermudans | 9.0 /100 | #212 | Tragic 2.2% |
| Immigrants | Ghana | 8.9 /100 | #213 | Tragic 2.2% |
| Trinidadians and Tobagonians | 8.2 /100 | #214 | Tragic 2.2% |
| Nigerians | 7.2 /100 | #215 | Tragic 2.3% |
| Immigrants | Trinidad and Tobago | 6.1 /100 | #216 | Tragic 2.3% |
| Barbadians | 5.1 /100 | #217 | Tragic 2.3% |
| Portuguese | 4.9 /100 | #218 | Tragic 2.3% |
| Ecuadorians | 4.6 /100 | #219 | Tragic 2.3% |
| Guamanians/Chamorros | 3.9 /100 | #220 | Tragic 2.3% |
| French Canadians | 3.9 /100 | #221 | Tragic 2.3% |
Demographics Similar to Native Hawaiians by Vision Disability
In terms of vision disability, the demographic groups most similar to Native Hawaiians are Immigrants from Middle Africa (2.2%, a difference of 0.020%), Moroccan (2.2%, a difference of 0.14%), Immigrants from St. Vincent and the Grenadines (2.2%, a difference of 0.22%), Immigrants from Burma/Myanmar (2.2%, a difference of 0.31%), and Guyanese (2.2%, a difference of 0.32%).
| Demographics | Rating | Rank | Vision Disability |
| Immigrants | North America | 44.5 /100 | #179 | Average 2.2% |
| Uruguayans | 42.7 /100 | #180 | Average 2.2% |
| Immigrants | Western Europe | 41.1 /100 | #181 | Average 2.2% |
| Costa Ricans | 40.7 /100 | #182 | Average 2.2% |
| Immigrants | Burma/Myanmar | 37.9 /100 | #183 | Fair 2.2% |
| Moroccans | 35.4 /100 | #184 | Fair 2.2% |
| Immigrants | Middle Africa | 33.5 /100 | #185 | Fair 2.2% |
| Native Hawaiians | 33.3 /100 | #186 | Fair 2.2% |
| Immigrants | St. Vincent and the Grenadines | 30.3 /100 | #187 | Fair 2.2% |
| Guyanese | 28.9 /100 | #188 | Fair 2.2% |
| Salvadorans | 27.4 /100 | #189 | Fair 2.2% |
| Immigrants | Costa Rica | 26.1 /100 | #190 | Fair 2.2% |
| Canadians | 25.8 /100 | #191 | Fair 2.2% |
| Europeans | 25.7 /100 | #192 | Fair 2.2% |
| British | 25.1 /100 | #193 | Fair 2.2% |