Trinidadian and Tobagonian vs Native Hawaiian Currently Married
COMPARE
Trinidadian and Tobagonian
Native Hawaiian
Currently Married
Currently Married Comparison
Trinidadians and Tobagonians
Native Hawaiians
41.5%
CURRENTLY MARRIED
0.0/ 100
METRIC RATING
311th/ 347
METRIC RANK
47.9%
CURRENTLY MARRIED
95.0/ 100
METRIC RATING
94th/ 347
METRIC RANK
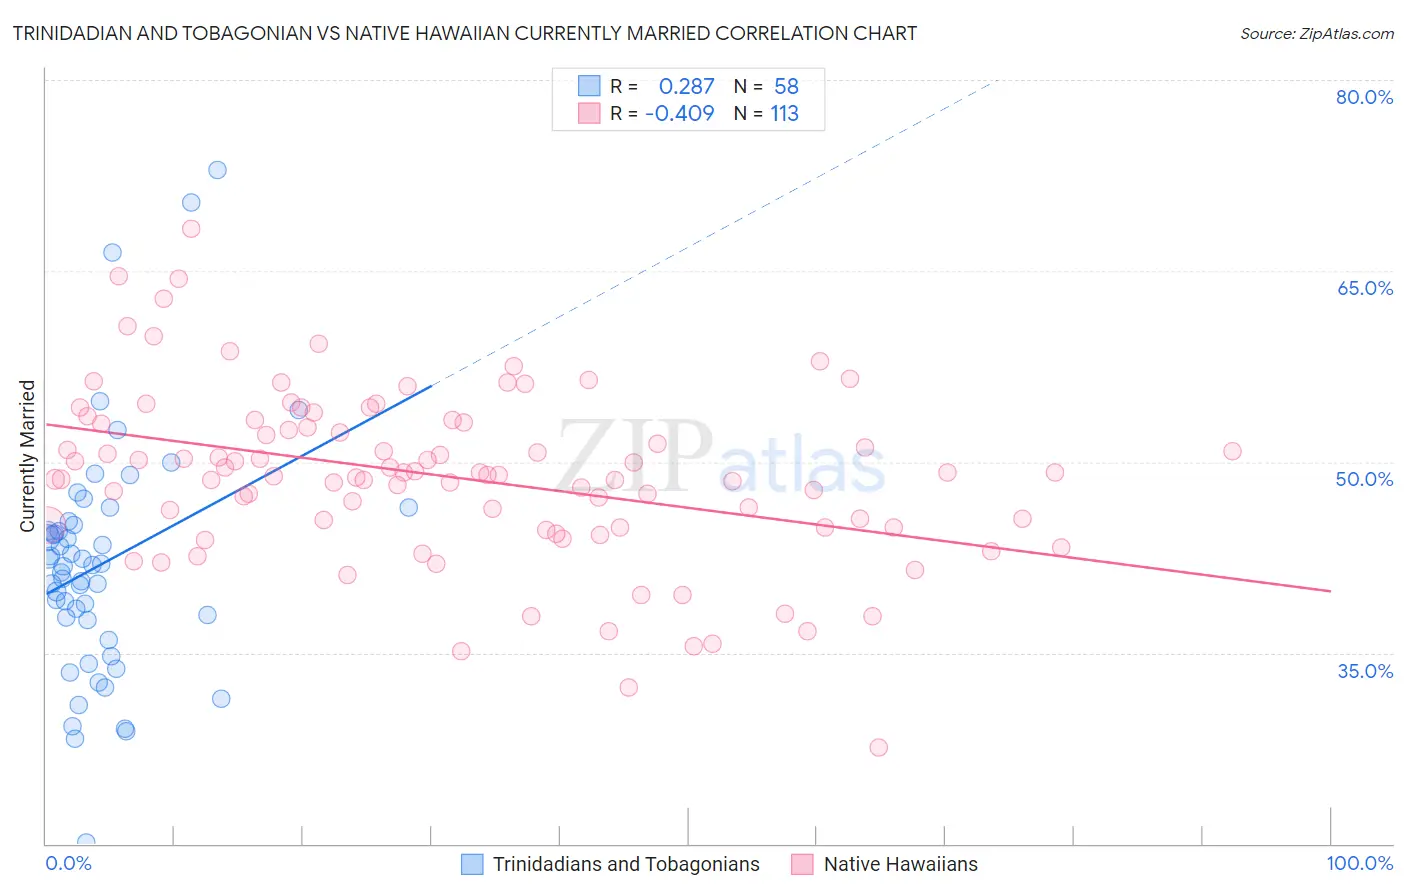
Trinidadian and Tobagonian vs Native Hawaiian Currently Married Correlation Chart
The statistical analysis conducted on geographies consisting of 219,846,005 people shows a weak positive correlation between the proportion of Trinidadians and Tobagonians and percentage of population currently married in the United States with a correlation coefficient (R) of 0.287 and weighted average of 41.5%. Similarly, the statistical analysis conducted on geographies consisting of 332,071,808 people shows a moderate negative correlation between the proportion of Native Hawaiians and percentage of population currently married in the United States with a correlation coefficient (R) of -0.409 and weighted average of 47.9%, a difference of 15.3%.
Currently Married Correlation Summary
| Measurement | Trinidadian and Tobagonian | Native Hawaiian |
| Minimum | 20.1% | 27.6% |
| Maximum | 72.9% | 68.3% |
| Range | 52.8% | 40.7% |
| Mean | 41.9% | 48.8% |
| Median | 41.8% | 49.0% |
| Interquartile 25% (IQ1) | 37.6% | 44.8% |
| Interquartile 75% (IQ3) | 45.0% | 53.0% |
| Interquartile Range (IQR) | 7.5% | 8.2% |
| Standard Deviation (Sample) | 9.4% | 6.8% |
| Standard Deviation (Population) | 9.4% | 6.8% |
Similar Demographics by Currently Married
Demographics Similar to Trinidadians and Tobagonians by Currently Married
In terms of currently married, the demographic groups most similar to Trinidadians and Tobagonians are Guyanese (41.6%, a difference of 0.15%), Somali (41.5%, a difference of 0.18%), Jamaican (41.4%, a difference of 0.47%), Immigrants from Liberia (41.8%, a difference of 0.51%), and West Indian (41.3%, a difference of 0.55%).
| Demographics | Rating | Rank | Currently Married |
| Immigrants | Bahamas | 0.0 /100 | #304 | Tragic 41.9% |
| Immigrants | Trinidad and Tobago | 0.0 /100 | #305 | Tragic 41.9% |
| Immigrants | Guyana | 0.0 /100 | #306 | Tragic 41.9% |
| Africans | 0.0 /100 | #307 | Tragic 41.8% |
| Immigrants | Belize | 0.0 /100 | #308 | Tragic 41.8% |
| Immigrants | Liberia | 0.0 /100 | #309 | Tragic 41.8% |
| Guyanese | 0.0 /100 | #310 | Tragic 41.6% |
| Trinidadians and Tobagonians | 0.0 /100 | #311 | Tragic 41.5% |
| Somalis | 0.0 /100 | #312 | Tragic 41.5% |
| Jamaicans | 0.0 /100 | #313 | Tragic 41.4% |
| West Indians | 0.0 /100 | #314 | Tragic 41.3% |
| Inupiat | 0.0 /100 | #315 | Tragic 41.3% |
| Immigrants | Caribbean | 0.0 /100 | #316 | Tragic 41.3% |
| Haitians | 0.0 /100 | #317 | Tragic 41.3% |
| Bahamians | 0.0 /100 | #318 | Tragic 41.2% |
Demographics Similar to Native Hawaiians by Currently Married
In terms of currently married, the demographic groups most similar to Native Hawaiians are Lebanese (47.9%, a difference of 0.010%), Immigrants from Bulgaria (47.9%, a difference of 0.040%), Egyptian (47.9%, a difference of 0.040%), Immigrants from Ukraine (47.9%, a difference of 0.040%), and Immigrants from China (47.9%, a difference of 0.060%).
| Demographics | Rating | Rank | Currently Married |
| Jordanians | 96.2 /100 | #87 | Exceptional 48.0% |
| Immigrants | Eastern Europe | 96.1 /100 | #88 | Exceptional 48.0% |
| Indians (Asian) | 95.8 /100 | #89 | Exceptional 48.0% |
| Americans | 95.7 /100 | #90 | Exceptional 48.0% |
| Immigrants | Bolivia | 95.6 /100 | #91 | Exceptional 47.9% |
| Koreans | 95.4 /100 | #92 | Exceptional 47.9% |
| Lebanese | 95.1 /100 | #93 | Exceptional 47.9% |
| Native Hawaiians | 95.0 /100 | #94 | Exceptional 47.9% |
| Immigrants | Bulgaria | 94.8 /100 | #95 | Exceptional 47.9% |
| Egyptians | 94.8 /100 | #96 | Exceptional 47.9% |
| Immigrants | Ukraine | 94.8 /100 | #97 | Exceptional 47.9% |
| Immigrants | China | 94.7 /100 | #98 | Exceptional 47.9% |
| Immigrants | Sweden | 94.3 /100 | #99 | Exceptional 47.8% |
| Celtics | 94.2 /100 | #100 | Exceptional 47.8% |
| Immigrants | Germany | 94.1 /100 | #101 | Exceptional 47.8% |