Trinidadian and Tobagonian vs Eastern European Vision Disability
COMPARE
Trinidadian and Tobagonian
Eastern European
Vision Disability
Vision Disability Comparison
Trinidadians and Tobagonians
Eastern Europeans
2.2%
VISION DISABILITY
8.2/ 100
METRIC RATING
214th/ 347
METRIC RANK
2.0%
VISION DISABILITY
99.7/ 100
METRIC RATING
43rd/ 347
METRIC RANK
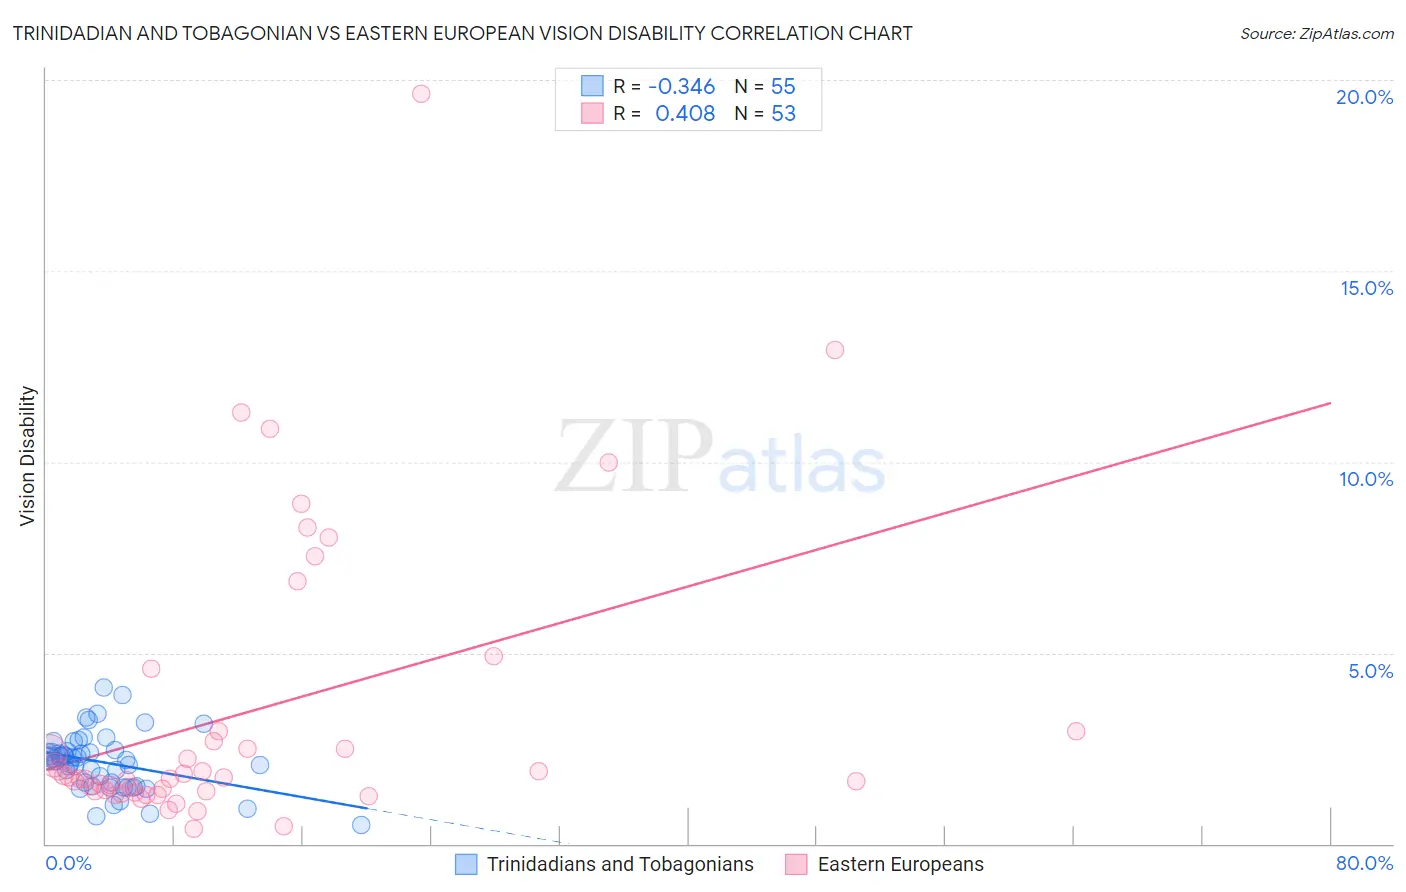
Trinidadian and Tobagonian vs Eastern European Vision Disability Correlation Chart
The statistical analysis conducted on geographies consisting of 219,745,653 people shows a mild negative correlation between the proportion of Trinidadians and Tobagonians and percentage of population with vision disability in the United States with a correlation coefficient (R) of -0.346 and weighted average of 2.2%. Similarly, the statistical analysis conducted on geographies consisting of 460,582,100 people shows a moderate positive correlation between the proportion of Eastern Europeans and percentage of population with vision disability in the United States with a correlation coefficient (R) of 0.408 and weighted average of 2.0%, a difference of 14.1%.
Vision Disability Correlation Summary
| Measurement | Trinidadian and Tobagonian | Eastern European |
| Minimum | 0.49% | 0.38% |
| Maximum | 4.1% | 19.6% |
| Range | 3.6% | 19.2% |
| Mean | 2.1% | 3.4% |
| Median | 2.2% | 1.7% |
| Interquartile 25% (IQ1) | 1.5% | 1.4% |
| Interquartile 75% (IQ3) | 2.4% | 3.0% |
| Interquartile Range (IQR) | 0.92% | 1.6% |
| Standard Deviation (Sample) | 0.75% | 3.8% |
| Standard Deviation (Population) | 0.74% | 3.8% |
Similar Demographics by Vision Disability
Demographics Similar to Trinidadians and Tobagonians by Vision Disability
In terms of vision disability, the demographic groups most similar to Trinidadians and Tobagonians are Immigrants from Ghana (2.2%, a difference of 0.13%), Bermudan (2.2%, a difference of 0.14%), Nigerian (2.3%, a difference of 0.21%), Indonesian (2.2%, a difference of 0.23%), and Immigrants from Trinidad and Tobago (2.3%, a difference of 0.50%).
| Demographics | Rating | Rank | Vision Disability |
| Immigrants | Nigeria | 13.5 /100 | #207 | Poor 2.2% |
| Germans | 13.4 /100 | #208 | Poor 2.2% |
| Immigrants | Brazil | 13.1 /100 | #209 | Poor 2.2% |
| Immigrants | Uruguay | 11.5 /100 | #210 | Poor 2.2% |
| Indonesians | 9.5 /100 | #211 | Tragic 2.2% |
| Bermudans | 9.0 /100 | #212 | Tragic 2.2% |
| Immigrants | Ghana | 8.9 /100 | #213 | Tragic 2.2% |
| Trinidadians and Tobagonians | 8.2 /100 | #214 | Tragic 2.2% |
| Nigerians | 7.2 /100 | #215 | Tragic 2.3% |
| Immigrants | Trinidad and Tobago | 6.1 /100 | #216 | Tragic 2.3% |
| Barbadians | 5.1 /100 | #217 | Tragic 2.3% |
| Portuguese | 4.9 /100 | #218 | Tragic 2.3% |
| Ecuadorians | 4.6 /100 | #219 | Tragic 2.3% |
| Guamanians/Chamorros | 3.9 /100 | #220 | Tragic 2.3% |
| French Canadians | 3.9 /100 | #221 | Tragic 2.3% |
Demographics Similar to Eastern Europeans by Vision Disability
In terms of vision disability, the demographic groups most similar to Eastern Europeans are Immigrants from Indonesia (2.0%, a difference of 0.020%), Ethiopian (2.0%, a difference of 0.050%), Immigrants from Ethiopia (2.0%, a difference of 0.060%), Immigrants from Sweden (2.0%, a difference of 0.090%), and Immigrants from Bulgaria (2.0%, a difference of 0.11%).
| Demographics | Rating | Rank | Vision Disability |
| Cambodians | 99.8 /100 | #36 | Exceptional 2.0% |
| Bhutanese | 99.8 /100 | #37 | Exceptional 2.0% |
| Immigrants | Kuwait | 99.8 /100 | #38 | Exceptional 2.0% |
| Zimbabweans | 99.7 /100 | #39 | Exceptional 2.0% |
| Immigrants | Ireland | 99.7 /100 | #40 | Exceptional 2.0% |
| Cypriots | 99.7 /100 | #41 | Exceptional 2.0% |
| Immigrants | Ethiopia | 99.7 /100 | #42 | Exceptional 2.0% |
| Eastern Europeans | 99.7 /100 | #43 | Exceptional 2.0% |
| Immigrants | Indonesia | 99.7 /100 | #44 | Exceptional 2.0% |
| Ethiopians | 99.7 /100 | #45 | Exceptional 2.0% |
| Immigrants | Sweden | 99.7 /100 | #46 | Exceptional 2.0% |
| Immigrants | Bulgaria | 99.7 /100 | #47 | Exceptional 2.0% |
| Israelis | 99.6 /100 | #48 | Exceptional 2.0% |
| Latvians | 99.5 /100 | #49 | Exceptional 2.0% |
| Afghans | 99.5 /100 | #50 | Exceptional 2.0% |