Somali vs Native Hawaiian Vision Disability
COMPARE
Somali
Native Hawaiian
Vision Disability
Vision Disability Comparison
Somalis
Native Hawaiians
2.0%
VISION DISABILITY
99.2/ 100
METRIC RATING
57th/ 347
METRIC RANK
2.2%
VISION DISABILITY
33.3/ 100
METRIC RATING
186th/ 347
METRIC RANK
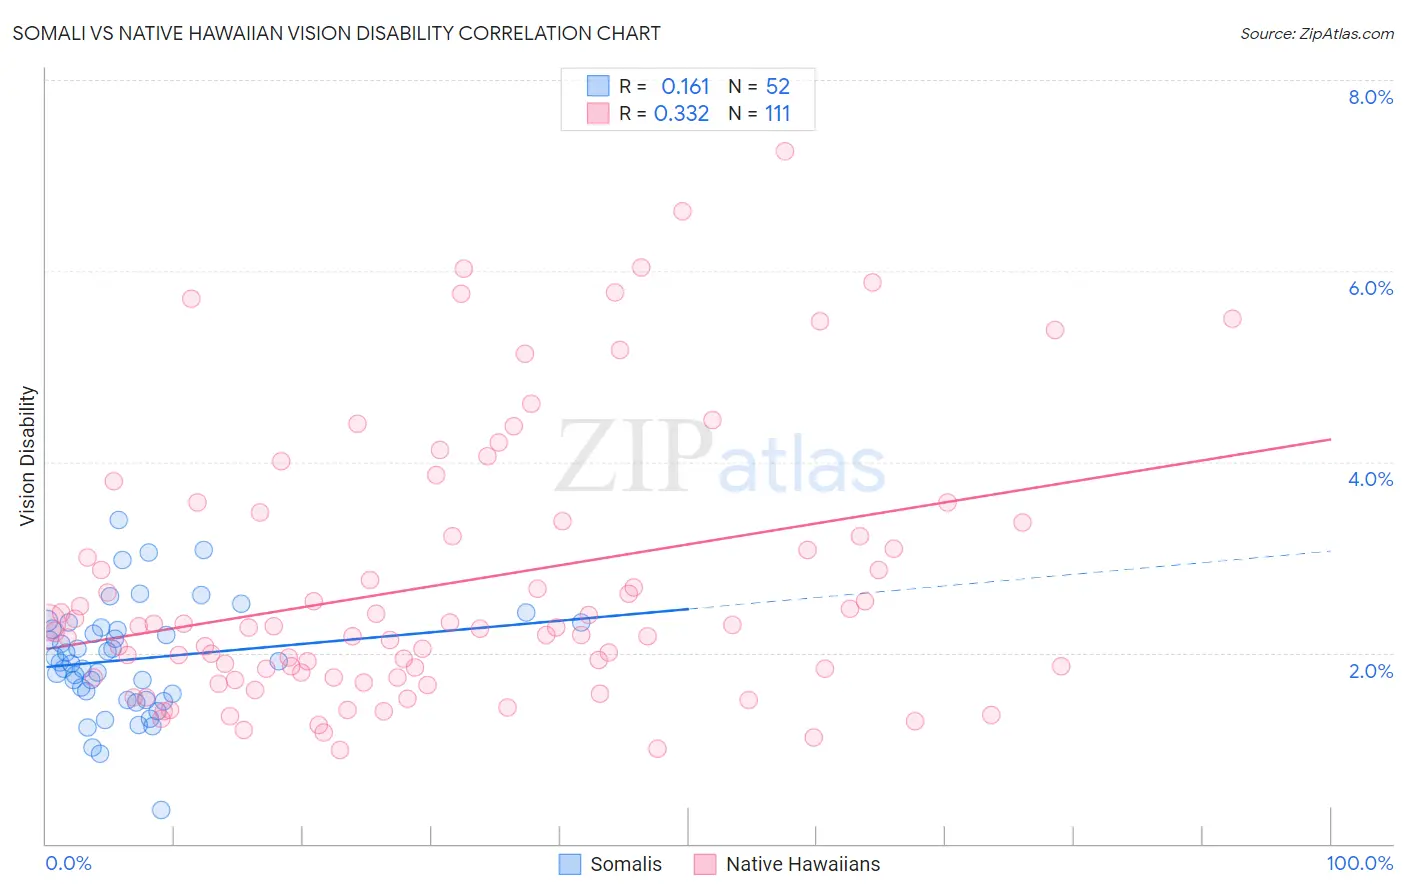
Somali vs Native Hawaiian Vision Disability Correlation Chart
The statistical analysis conducted on geographies consisting of 99,264,123 people shows a poor positive correlation between the proportion of Somalis and percentage of population with vision disability in the United States with a correlation coefficient (R) of 0.161 and weighted average of 2.0%. Similarly, the statistical analysis conducted on geographies consisting of 331,807,196 people shows a mild positive correlation between the proportion of Native Hawaiians and percentage of population with vision disability in the United States with a correlation coefficient (R) of 0.332 and weighted average of 2.2%, a difference of 9.5%.
Vision Disability Correlation Summary
| Measurement | Somali | Native Hawaiian |
| Minimum | 0.35% | 0.98% |
| Maximum | 3.4% | 7.3% |
| Range | 3.0% | 6.3% |
| Mean | 1.9% | 2.7% |
| Median | 1.9% | 2.3% |
| Interquartile 25% (IQ1) | 1.5% | 1.7% |
| Interquartile 75% (IQ3) | 2.3% | 3.4% |
| Interquartile Range (IQR) | 0.72% | 1.6% |
| Standard Deviation (Sample) | 0.58% | 1.4% |
| Standard Deviation (Population) | 0.57% | 1.4% |
Similar Demographics by Vision Disability
Demographics Similar to Somalis by Vision Disability
In terms of vision disability, the demographic groups most similar to Somalis are Jordanian (2.0%, a difference of 0.020%), Immigrants from Saudi Arabia (2.0%, a difference of 0.070%), Laotian (2.0%, a difference of 0.19%), Argentinean (2.0%, a difference of 0.21%), and Macedonian (2.0%, a difference of 0.24%).
| Demographics | Rating | Rank | Vision Disability |
| Afghans | 99.5 /100 | #50 | Exceptional 2.0% |
| Tongans | 99.5 /100 | #51 | Exceptional 2.0% |
| Immigrants | Serbia | 99.4 /100 | #52 | Exceptional 2.0% |
| Immigrants | Belarus | 99.3 /100 | #53 | Exceptional 2.0% |
| Macedonians | 99.3 /100 | #54 | Exceptional 2.0% |
| Laotians | 99.3 /100 | #55 | Exceptional 2.0% |
| Jordanians | 99.2 /100 | #56 | Exceptional 2.0% |
| Somalis | 99.2 /100 | #57 | Exceptional 2.0% |
| Immigrants | Saudi Arabia | 99.2 /100 | #58 | Exceptional 2.0% |
| Argentineans | 99.1 /100 | #59 | Exceptional 2.0% |
| Immigrants | Romania | 99.1 /100 | #60 | Exceptional 2.0% |
| Immigrants | Belgium | 99.1 /100 | #61 | Exceptional 2.0% |
| Immigrants | Russia | 99.1 /100 | #62 | Exceptional 2.0% |
| Armenians | 99.0 /100 | #63 | Exceptional 2.0% |
| Immigrants | Greece | 99.0 /100 | #64 | Exceptional 2.0% |
Demographics Similar to Native Hawaiians by Vision Disability
In terms of vision disability, the demographic groups most similar to Native Hawaiians are Immigrants from Middle Africa (2.2%, a difference of 0.020%), Moroccan (2.2%, a difference of 0.14%), Immigrants from St. Vincent and the Grenadines (2.2%, a difference of 0.22%), Immigrants from Burma/Myanmar (2.2%, a difference of 0.31%), and Guyanese (2.2%, a difference of 0.32%).
| Demographics | Rating | Rank | Vision Disability |
| Immigrants | North America | 44.5 /100 | #179 | Average 2.2% |
| Uruguayans | 42.7 /100 | #180 | Average 2.2% |
| Immigrants | Western Europe | 41.1 /100 | #181 | Average 2.2% |
| Costa Ricans | 40.7 /100 | #182 | Average 2.2% |
| Immigrants | Burma/Myanmar | 37.9 /100 | #183 | Fair 2.2% |
| Moroccans | 35.4 /100 | #184 | Fair 2.2% |
| Immigrants | Middle Africa | 33.5 /100 | #185 | Fair 2.2% |
| Native Hawaiians | 33.3 /100 | #186 | Fair 2.2% |
| Immigrants | St. Vincent and the Grenadines | 30.3 /100 | #187 | Fair 2.2% |
| Guyanese | 28.9 /100 | #188 | Fair 2.2% |
| Salvadorans | 27.4 /100 | #189 | Fair 2.2% |
| Immigrants | Costa Rica | 26.1 /100 | #190 | Fair 2.2% |
| Canadians | 25.8 /100 | #191 | Fair 2.2% |
| Europeans | 25.7 /100 | #192 | Fair 2.2% |
| British | 25.1 /100 | #193 | Fair 2.2% |