Trinidadian and Tobagonian vs Ghanaian Ambulatory Disability
COMPARE
Trinidadian and Tobagonian
Ghanaian
Ambulatory Disability
Ambulatory Disability Comparison
Trinidadians and Tobagonians
Ghanaians
6.6%
AMBULATORY DISABILITY
0.2/ 100
METRIC RATING
267th/ 347
METRIC RANK
6.0%
AMBULATORY DISABILITY
71.3/ 100
METRIC RATING
157th/ 347
METRIC RANK
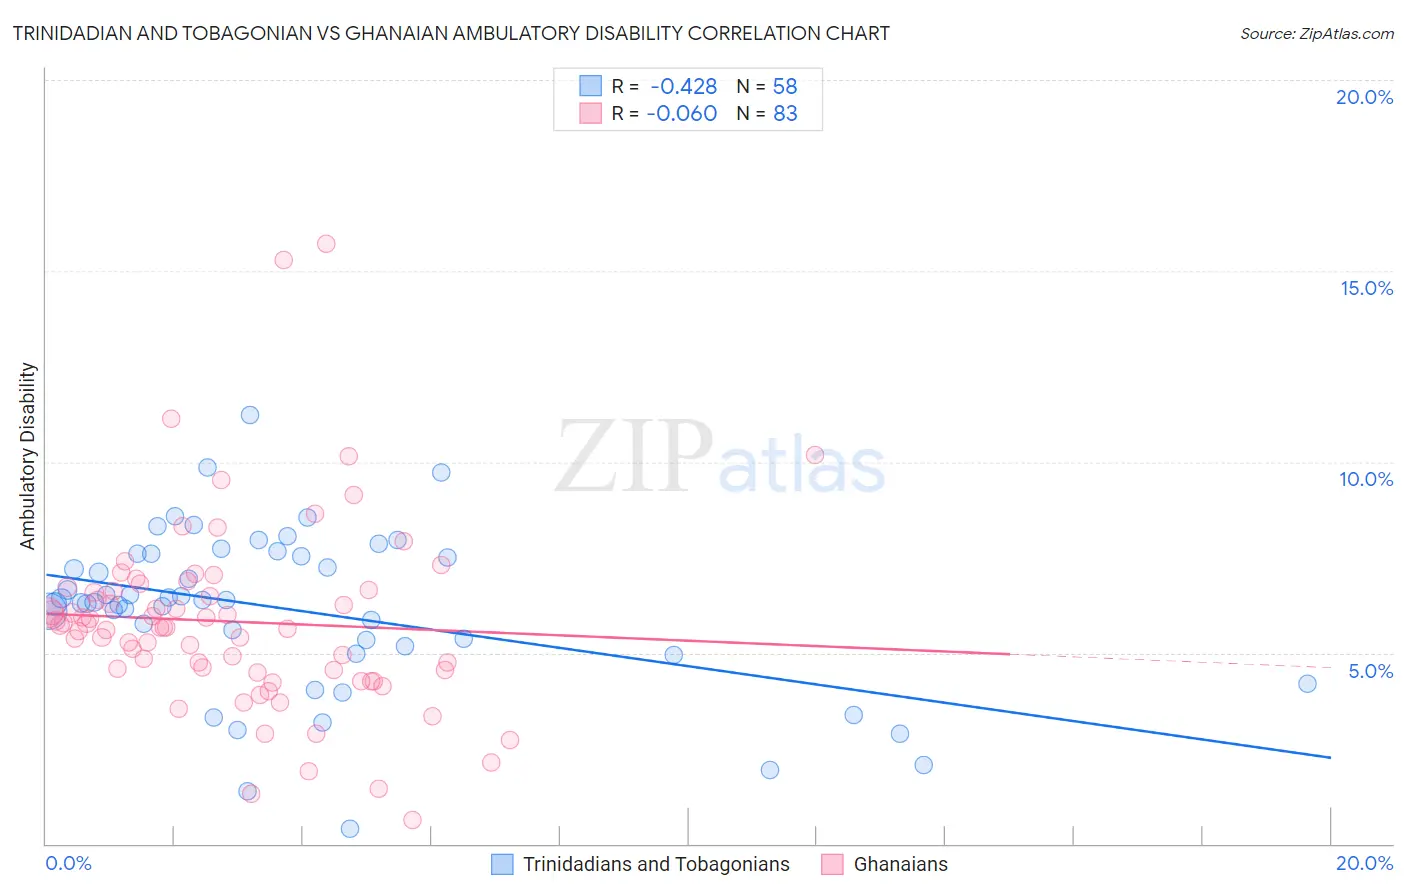
Trinidadian and Tobagonian vs Ghanaian Ambulatory Disability Correlation Chart
The statistical analysis conducted on geographies consisting of 219,787,552 people shows a moderate negative correlation between the proportion of Trinidadians and Tobagonians and percentage of population with ambulatory disability in the United States with a correlation coefficient (R) of -0.428 and weighted average of 6.6%. Similarly, the statistical analysis conducted on geographies consisting of 190,643,390 people shows a slight negative correlation between the proportion of Ghanaians and percentage of population with ambulatory disability in the United States with a correlation coefficient (R) of -0.060 and weighted average of 6.0%, a difference of 9.7%.
Ambulatory Disability Correlation Summary
| Measurement | Trinidadian and Tobagonian | Ghanaian |
| Minimum | 0.38% | 0.61% |
| Maximum | 11.2% | 15.7% |
| Range | 10.8% | 15.1% |
| Mean | 6.1% | 5.8% |
| Median | 6.3% | 5.7% |
| Interquartile 25% (IQ1) | 5.2% | 4.5% |
| Interquartile 75% (IQ3) | 7.6% | 6.6% |
| Interquartile Range (IQR) | 2.4% | 2.1% |
| Standard Deviation (Sample) | 2.1% | 2.5% |
| Standard Deviation (Population) | 2.1% | 2.4% |
Similar Demographics by Ambulatory Disability
Demographics Similar to Trinidadians and Tobagonians by Ambulatory Disability
In terms of ambulatory disability, the demographic groups most similar to Trinidadians and Tobagonians are Spanish (6.6%, a difference of 0.020%), Guyanese (6.6%, a difference of 0.13%), Bahamian (6.6%, a difference of 0.25%), Nepalese (6.6%, a difference of 0.31%), and French (6.6%, a difference of 0.32%).
| Demographics | Rating | Rank | Ambulatory Disability |
| Immigrants | Belize | 0.4 /100 | #260 | Tragic 6.6% |
| Irish | 0.4 /100 | #261 | Tragic 6.6% |
| English | 0.4 /100 | #262 | Tragic 6.6% |
| Hmong | 0.3 /100 | #263 | Tragic 6.6% |
| Nepalese | 0.2 /100 | #264 | Tragic 6.6% |
| Bahamians | 0.2 /100 | #265 | Tragic 6.6% |
| Guyanese | 0.2 /100 | #266 | Tragic 6.6% |
| Trinidadians and Tobagonians | 0.2 /100 | #267 | Tragic 6.6% |
| Spanish | 0.2 /100 | #268 | Tragic 6.6% |
| French | 0.1 /100 | #269 | Tragic 6.6% |
| Slovaks | 0.1 /100 | #270 | Tragic 6.7% |
| Immigrants | Trinidad and Tobago | 0.1 /100 | #271 | Tragic 6.7% |
| French Canadians | 0.1 /100 | #272 | Tragic 6.7% |
| Whites/Caucasians | 0.1 /100 | #273 | Tragic 6.7% |
| Sioux | 0.1 /100 | #274 | Tragic 6.7% |
Demographics Similar to Ghanaians by Ambulatory Disability
In terms of ambulatory disability, the demographic groups most similar to Ghanaians are Immigrants from Fiji (6.0%, a difference of 0.010%), Immigrants from Latvia (6.0%, a difference of 0.020%), Northern European (6.0%, a difference of 0.030%), Immigrants from Scotland (6.0%, a difference of 0.050%), and Central American (6.0%, a difference of 0.10%).
| Demographics | Rating | Rank | Ambulatory Disability |
| Maltese | 81.6 /100 | #150 | Excellent 6.0% |
| Greeks | 79.6 /100 | #151 | Good 6.0% |
| Immigrants | Austria | 78.8 /100 | #152 | Good 6.0% |
| Syrians | 75.5 /100 | #153 | Good 6.0% |
| Immigrants | Croatia | 75.1 /100 | #154 | Good 6.0% |
| Immigrants | Scotland | 72.1 /100 | #155 | Good 6.0% |
| Northern Europeans | 71.8 /100 | #156 | Good 6.0% |
| Ghanaians | 71.3 /100 | #157 | Good 6.0% |
| Immigrants | Fiji | 71.2 /100 | #158 | Good 6.0% |
| Immigrants | Latvia | 71.1 /100 | #159 | Good 6.0% |
| Central Americans | 69.8 /100 | #160 | Good 6.0% |
| Immigrants | Belarus | 69.2 /100 | #161 | Good 6.1% |
| Nigerians | 67.1 /100 | #162 | Good 6.1% |
| Lebanese | 66.2 /100 | #163 | Good 6.1% |
| Basques | 63.7 /100 | #164 | Good 6.1% |