Trinidadian and Tobagonian vs Alaska Native Ambulatory Disability
COMPARE
Trinidadian and Tobagonian
Alaska Native
Ambulatory Disability
Ambulatory Disability Comparison
Trinidadians and Tobagonians
Alaska Natives
6.6%
AMBULATORY DISABILITY
0.2/ 100
METRIC RATING
267th/ 347
METRIC RANK
6.2%
AMBULATORY DISABILITY
29.8/ 100
METRIC RATING
194th/ 347
METRIC RANK
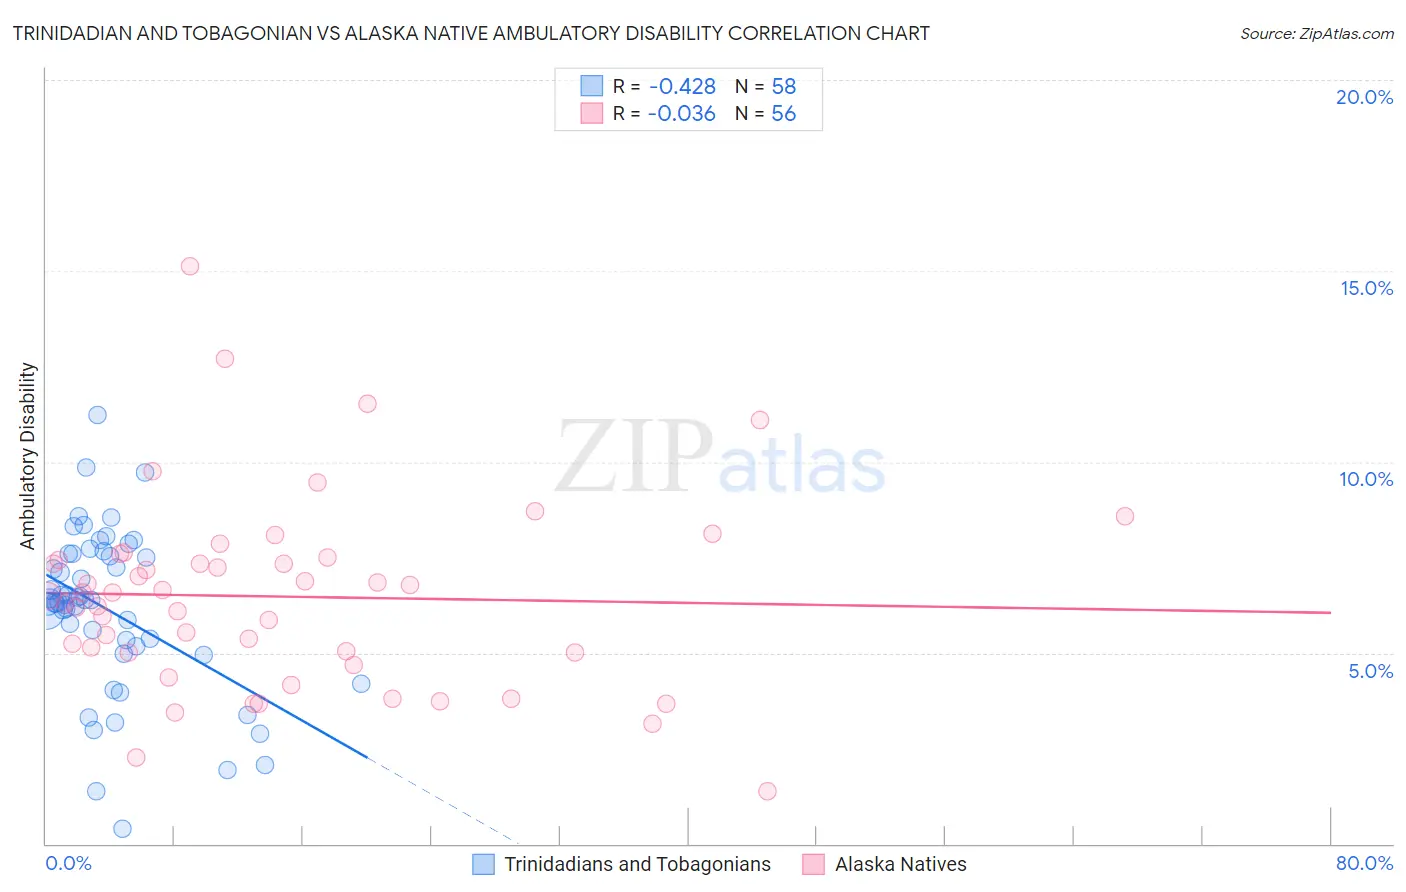
Trinidadian and Tobagonian vs Alaska Native Ambulatory Disability Correlation Chart
The statistical analysis conducted on geographies consisting of 219,787,552 people shows a moderate negative correlation between the proportion of Trinidadians and Tobagonians and percentage of population with ambulatory disability in the United States with a correlation coefficient (R) of -0.428 and weighted average of 6.6%. Similarly, the statistical analysis conducted on geographies consisting of 76,753,099 people shows no correlation between the proportion of Alaska Natives and percentage of population with ambulatory disability in the United States with a correlation coefficient (R) of -0.036 and weighted average of 6.2%, a difference of 7.1%.
Ambulatory Disability Correlation Summary
| Measurement | Trinidadian and Tobagonian | Alaska Native |
| Minimum | 0.38% | 1.4% |
| Maximum | 11.2% | 15.1% |
| Range | 10.8% | 13.8% |
| Mean | 6.1% | 6.5% |
| Median | 6.3% | 6.5% |
| Interquartile 25% (IQ1) | 5.2% | 5.0% |
| Interquartile 75% (IQ3) | 7.6% | 7.5% |
| Interquartile Range (IQR) | 2.4% | 2.5% |
| Standard Deviation (Sample) | 2.1% | 2.5% |
| Standard Deviation (Population) | 2.1% | 2.5% |
Similar Demographics by Ambulatory Disability
Demographics Similar to Trinidadians and Tobagonians by Ambulatory Disability
In terms of ambulatory disability, the demographic groups most similar to Trinidadians and Tobagonians are Spanish (6.6%, a difference of 0.020%), Guyanese (6.6%, a difference of 0.13%), Bahamian (6.6%, a difference of 0.25%), Nepalese (6.6%, a difference of 0.31%), and French (6.6%, a difference of 0.32%).
| Demographics | Rating | Rank | Ambulatory Disability |
| Immigrants | Belize | 0.4 /100 | #260 | Tragic 6.6% |
| Irish | 0.4 /100 | #261 | Tragic 6.6% |
| English | 0.4 /100 | #262 | Tragic 6.6% |
| Hmong | 0.3 /100 | #263 | Tragic 6.6% |
| Nepalese | 0.2 /100 | #264 | Tragic 6.6% |
| Bahamians | 0.2 /100 | #265 | Tragic 6.6% |
| Guyanese | 0.2 /100 | #266 | Tragic 6.6% |
| Trinidadians and Tobagonians | 0.2 /100 | #267 | Tragic 6.6% |
| Spanish | 0.2 /100 | #268 | Tragic 6.6% |
| French | 0.1 /100 | #269 | Tragic 6.6% |
| Slovaks | 0.1 /100 | #270 | Tragic 6.7% |
| Immigrants | Trinidad and Tobago | 0.1 /100 | #271 | Tragic 6.7% |
| French Canadians | 0.1 /100 | #272 | Tragic 6.7% |
| Whites/Caucasians | 0.1 /100 | #273 | Tragic 6.7% |
| Sioux | 0.1 /100 | #274 | Tragic 6.7% |
Demographics Similar to Alaska Natives by Ambulatory Disability
In terms of ambulatory disability, the demographic groups most similar to Alaska Natives are Guatemalan (6.2%, a difference of 0.010%), Belgian (6.2%, a difference of 0.080%), Malaysian (6.2%, a difference of 0.10%), Immigrants from Western Europe (6.2%, a difference of 0.11%), and Immigrants from Guatemala (6.2%, a difference of 0.13%).
| Demographics | Rating | Rank | Ambulatory Disability |
| Carpatho Rusyns | 35.3 /100 | #187 | Fair 6.2% |
| British | 34.3 /100 | #188 | Fair 6.2% |
| Ukrainians | 34.0 /100 | #189 | Fair 6.2% |
| Immigrants | Western Africa | 33.4 /100 | #190 | Fair 6.2% |
| Immigrants | Guatemala | 31.9 /100 | #191 | Fair 6.2% |
| Immigrants | Western Europe | 31.6 /100 | #192 | Fair 6.2% |
| Guatemalans | 30.0 /100 | #193 | Fair 6.2% |
| Alaska Natives | 29.8 /100 | #194 | Fair 6.2% |
| Belgians | 28.6 /100 | #195 | Fair 6.2% |
| Malaysians | 28.2 /100 | #196 | Fair 6.2% |
| Poles | 26.3 /100 | #197 | Fair 6.2% |
| Immigrants | Bangladesh | 24.6 /100 | #198 | Fair 6.2% |
| Italians | 22.6 /100 | #199 | Fair 6.2% |
| Immigrants | Cambodia | 21.5 /100 | #200 | Fair 6.2% |
| Immigrants | Central America | 20.1 /100 | #201 | Fair 6.2% |