Trinidadian and Tobagonian vs Immigrants from Middle Africa Ambulatory Disability
COMPARE
Trinidadian and Tobagonian
Immigrants from Middle Africa
Ambulatory Disability
Ambulatory Disability Comparison
Trinidadians and Tobagonians
Immigrants from Middle Africa
6.6%
AMBULATORY DISABILITY
0.2/ 100
METRIC RATING
267th/ 347
METRIC RANK
5.9%
AMBULATORY DISABILITY
92.2/ 100
METRIC RATING
124th/ 347
METRIC RANK
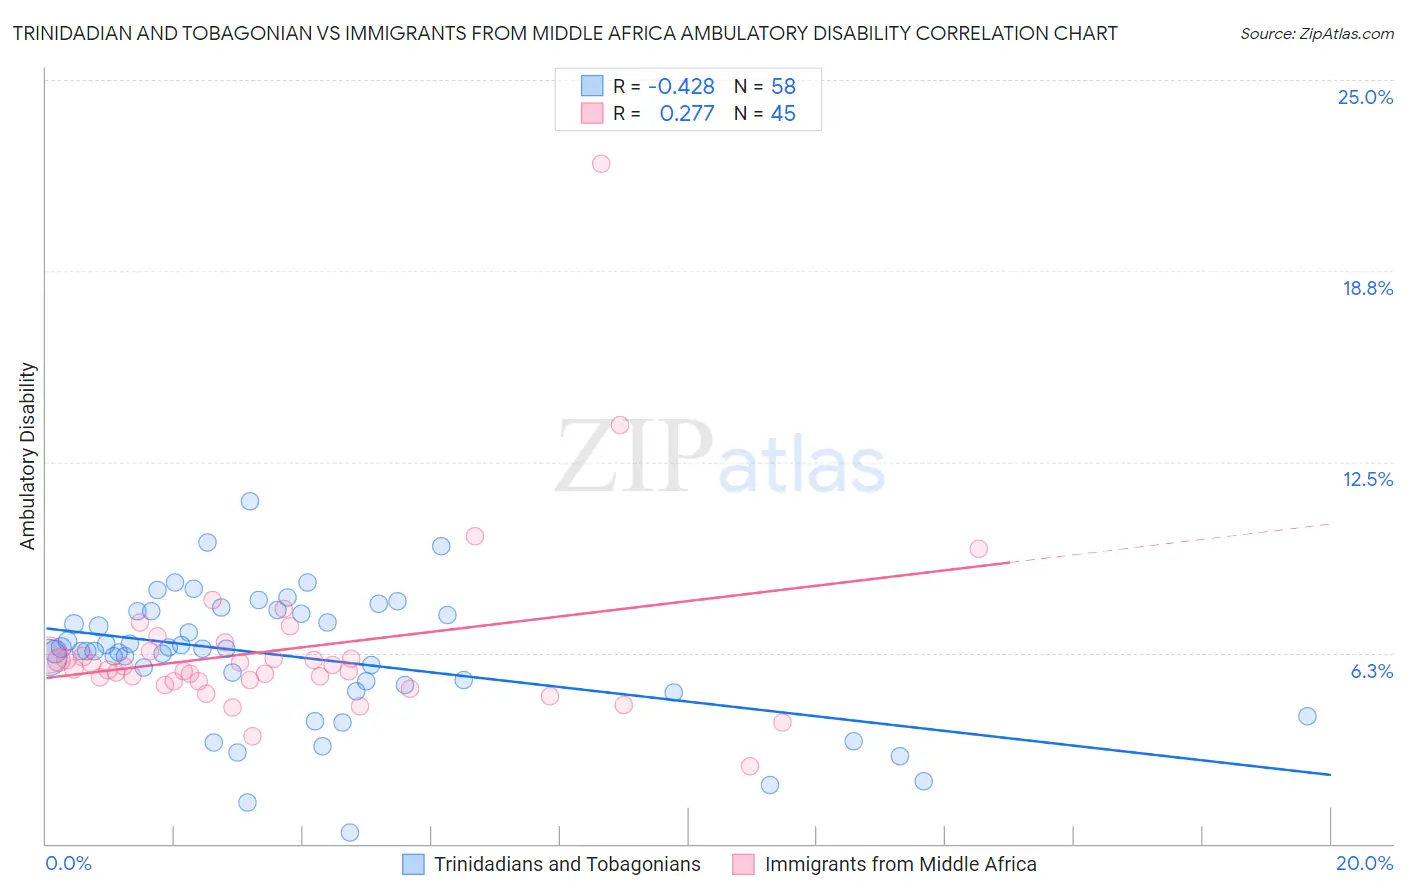
Trinidadian and Tobagonian vs Immigrants from Middle Africa Ambulatory Disability Correlation Chart
The statistical analysis conducted on geographies consisting of 219,787,552 people shows a moderate negative correlation between the proportion of Trinidadians and Tobagonians and percentage of population with ambulatory disability in the United States with a correlation coefficient (R) of -0.428 and weighted average of 6.6%. Similarly, the statistical analysis conducted on geographies consisting of 202,691,189 people shows a weak positive correlation between the proportion of Immigrants from Middle Africa and percentage of population with ambulatory disability in the United States with a correlation coefficient (R) of 0.277 and weighted average of 5.9%, a difference of 12.0%.
Ambulatory Disability Correlation Summary
| Measurement | Trinidadian and Tobagonian | Immigrants from Middle Africa |
| Minimum | 0.38% | 2.5% |
| Maximum | 11.2% | 22.3% |
| Range | 10.8% | 19.7% |
| Mean | 6.1% | 6.4% |
| Median | 6.3% | 5.7% |
| Interquartile 25% (IQ1) | 5.2% | 5.3% |
| Interquartile 75% (IQ3) | 7.6% | 6.2% |
| Interquartile Range (IQR) | 2.4% | 0.93% |
| Standard Deviation (Sample) | 2.1% | 3.0% |
| Standard Deviation (Population) | 2.1% | 3.0% |
Similar Demographics by Ambulatory Disability
Demographics Similar to Trinidadians and Tobagonians by Ambulatory Disability
In terms of ambulatory disability, the demographic groups most similar to Trinidadians and Tobagonians are Spanish (6.6%, a difference of 0.020%), Guyanese (6.6%, a difference of 0.13%), Bahamian (6.6%, a difference of 0.25%), Nepalese (6.6%, a difference of 0.31%), and French (6.6%, a difference of 0.32%).
| Demographics | Rating | Rank | Ambulatory Disability |
| Immigrants | Belize | 0.4 /100 | #260 | Tragic 6.6% |
| Irish | 0.4 /100 | #261 | Tragic 6.6% |
| English | 0.4 /100 | #262 | Tragic 6.6% |
| Hmong | 0.3 /100 | #263 | Tragic 6.6% |
| Nepalese | 0.2 /100 | #264 | Tragic 6.6% |
| Bahamians | 0.2 /100 | #265 | Tragic 6.6% |
| Guyanese | 0.2 /100 | #266 | Tragic 6.6% |
| Trinidadians and Tobagonians | 0.2 /100 | #267 | Tragic 6.6% |
| Spanish | 0.2 /100 | #268 | Tragic 6.6% |
| French | 0.1 /100 | #269 | Tragic 6.6% |
| Slovaks | 0.1 /100 | #270 | Tragic 6.7% |
| Immigrants | Trinidad and Tobago | 0.1 /100 | #271 | Tragic 6.7% |
| French Canadians | 0.1 /100 | #272 | Tragic 6.7% |
| Whites/Caucasians | 0.1 /100 | #273 | Tragic 6.7% |
| Sioux | 0.1 /100 | #274 | Tragic 6.7% |
Demographics Similar to Immigrants from Middle Africa by Ambulatory Disability
In terms of ambulatory disability, the demographic groups most similar to Immigrants from Middle Africa are Immigrants from Russia (5.9%, a difference of 0.040%), Costa Rican (5.9%, a difference of 0.060%), Icelander (5.9%, a difference of 0.060%), Korean (5.9%, a difference of 0.12%), and Estonian (5.9%, a difference of 0.13%).
| Demographics | Rating | Rank | Ambulatory Disability |
| Immigrants | South Eastern Asia | 93.6 /100 | #117 | Exceptional 5.9% |
| Russians | 93.4 /100 | #118 | Exceptional 5.9% |
| Norwegians | 93.1 /100 | #119 | Exceptional 5.9% |
| Estonians | 92.9 /100 | #120 | Exceptional 5.9% |
| Costa Ricans | 92.6 /100 | #121 | Exceptional 5.9% |
| Icelanders | 92.6 /100 | #122 | Exceptional 5.9% |
| Immigrants | Russia | 92.4 /100 | #123 | Exceptional 5.9% |
| Immigrants | Middle Africa | 92.2 /100 | #124 | Exceptional 5.9% |
| Koreans | 91.6 /100 | #125 | Exceptional 5.9% |
| Arabs | 91.5 /100 | #126 | Exceptional 5.9% |
| Immigrants | Nigeria | 90.9 /100 | #127 | Exceptional 5.9% |
| Immigrants | Western Asia | 90.7 /100 | #128 | Exceptional 5.9% |
| Immigrants | Norway | 90.5 /100 | #129 | Exceptional 5.9% |
| Immigrants | Kazakhstan | 89.7 /100 | #130 | Excellent 5.9% |
| Immigrants | Costa Rica | 89.5 /100 | #131 | Excellent 5.9% |