Trinidadian and Tobagonian vs German Russian Disability Age 65 to 74
COMPARE
Trinidadian and Tobagonian
German Russian
Disability Age 65 to 74
Disability Age 65 to 74 Comparison
Trinidadians and Tobagonians
German Russians
23.9%
DISABILITY AGE 65 TO 74
16.4/ 100
METRIC RATING
210th/ 347
METRIC RANK
24.4%
DISABILITY AGE 65 TO 74
3.7/ 100
METRIC RATING
236th/ 347
METRIC RANK
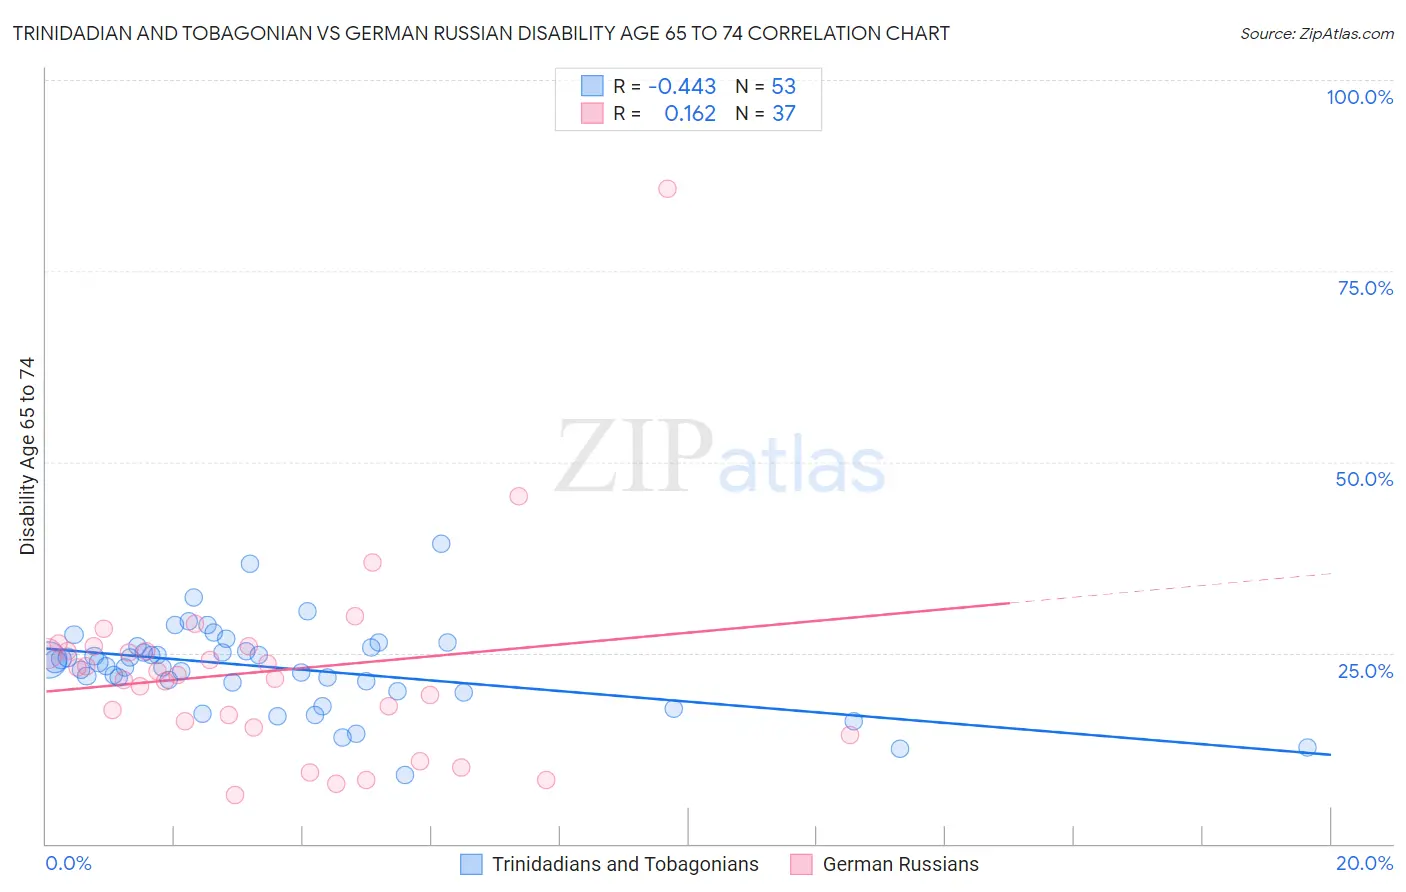
Trinidadian and Tobagonian vs German Russian Disability Age 65 to 74 Correlation Chart
The statistical analysis conducted on geographies consisting of 219,459,404 people shows a moderate negative correlation between the proportion of Trinidadians and Tobagonians and percentage of population with a disability between the ages 65 and 75 in the United States with a correlation coefficient (R) of -0.443 and weighted average of 23.9%. Similarly, the statistical analysis conducted on geographies consisting of 96,383,103 people shows a poor positive correlation between the proportion of German Russians and percentage of population with a disability between the ages 65 and 75 in the United States with a correlation coefficient (R) of 0.162 and weighted average of 24.4%, a difference of 2.3%.
Disability Age 65 to 74 Correlation Summary
| Measurement | Trinidadian and Tobagonian | German Russian |
| Minimum | 9.0% | 6.3% |
| Maximum | 39.2% | 85.7% |
| Range | 30.2% | 79.4% |
| Mean | 23.1% | 22.6% |
| Median | 23.7% | 22.1% |
| Interquartile 25% (IQ1) | 20.5% | 15.7% |
| Interquartile 75% (IQ3) | 25.8% | 25.5% |
| Interquartile Range (IQR) | 5.3% | 9.8% |
| Standard Deviation (Sample) | 5.6% | 13.5% |
| Standard Deviation (Population) | 5.6% | 13.3% |
Similar Demographics by Disability Age 65 to 74
Demographics Similar to Trinidadians and Tobagonians by Disability Age 65 to 74
In terms of disability age 65 to 74, the demographic groups most similar to Trinidadians and Tobagonians are Immigrants from West Indies (23.9%, a difference of 0.050%), French (23.9%, a difference of 0.070%), Nicaraguan (23.9%, a difference of 0.23%), Immigrants from Barbados (23.8%, a difference of 0.31%), and Immigrants from Kenya (23.8%, a difference of 0.31%).
| Demographics | Rating | Rank | Disability Age 65 to 74 |
| Kenyans | 23.2 /100 | #203 | Fair 23.7% |
| Immigrants | Grenada | 22.1 /100 | #204 | Fair 23.8% |
| Tongans | 20.8 /100 | #205 | Fair 23.8% |
| Immigrants | Jamaica | 20.7 /100 | #206 | Fair 23.8% |
| Immigrants | Sudan | 20.1 /100 | #207 | Fair 23.8% |
| Immigrants | Barbados | 19.6 /100 | #208 | Poor 23.8% |
| Immigrants | Kenya | 19.6 /100 | #209 | Poor 23.8% |
| Trinidadians and Tobagonians | 16.4 /100 | #210 | Poor 23.9% |
| Immigrants | West Indies | 15.9 /100 | #211 | Poor 23.9% |
| French | 15.7 /100 | #212 | Poor 23.9% |
| Nicaraguans | 14.3 /100 | #213 | Poor 23.9% |
| Immigrants | Oceania | 13.6 /100 | #214 | Poor 24.0% |
| Pennsylvania Germans | 13.3 /100 | #215 | Poor 24.0% |
| Jamaicans | 12.2 /100 | #216 | Poor 24.0% |
| Immigrants | Portugal | 11.7 /100 | #217 | Poor 24.0% |
Demographics Similar to German Russians by Disability Age 65 to 74
In terms of disability age 65 to 74, the demographic groups most similar to German Russians are Scotch-Irish (24.4%, a difference of 0.040%), West Indian (24.5%, a difference of 0.10%), Panamanian (24.4%, a difference of 0.19%), Immigrants from Ghana (24.5%, a difference of 0.27%), and Bahamian (24.4%, a difference of 0.30%).
| Demographics | Rating | Rank | Disability Age 65 to 74 |
| Celtics | 6.4 /100 | #229 | Tragic 24.2% |
| Barbadians | 6.0 /100 | #230 | Tragic 24.3% |
| Immigrants | Thailand | 5.2 /100 | #231 | Tragic 24.3% |
| Immigrants | Zaire | 5.0 /100 | #232 | Tragic 24.3% |
| Bahamians | 4.5 /100 | #233 | Tragic 24.4% |
| Panamanians | 4.2 /100 | #234 | Tragic 24.4% |
| Scotch-Irish | 3.8 /100 | #235 | Tragic 24.4% |
| German Russians | 3.7 /100 | #236 | Tragic 24.4% |
| West Indians | 3.4 /100 | #237 | Tragic 24.5% |
| Immigrants | Ghana | 3.0 /100 | #238 | Tragic 24.5% |
| Immigrants | Caribbean | 2.6 /100 | #239 | Tragic 24.6% |
| Spaniards | 2.4 /100 | #240 | Tragic 24.6% |
| Immigrants | Western Africa | 2.3 /100 | #241 | Tragic 24.6% |
| Immigrants | Senegal | 2.2 /100 | #242 | Tragic 24.6% |
| Spanish | 2.2 /100 | #243 | Tragic 24.6% |