Immigrants from France vs German Russian Disability Age 65 to 74
COMPARE
Immigrants from France
German Russian
Disability Age 65 to 74
Disability Age 65 to 74 Comparison
Immigrants from France
German Russians
21.5%
DISABILITY AGE 65 TO 74
99.6/ 100
METRIC RATING
52nd/ 347
METRIC RANK
24.4%
DISABILITY AGE 65 TO 74
3.7/ 100
METRIC RATING
236th/ 347
METRIC RANK
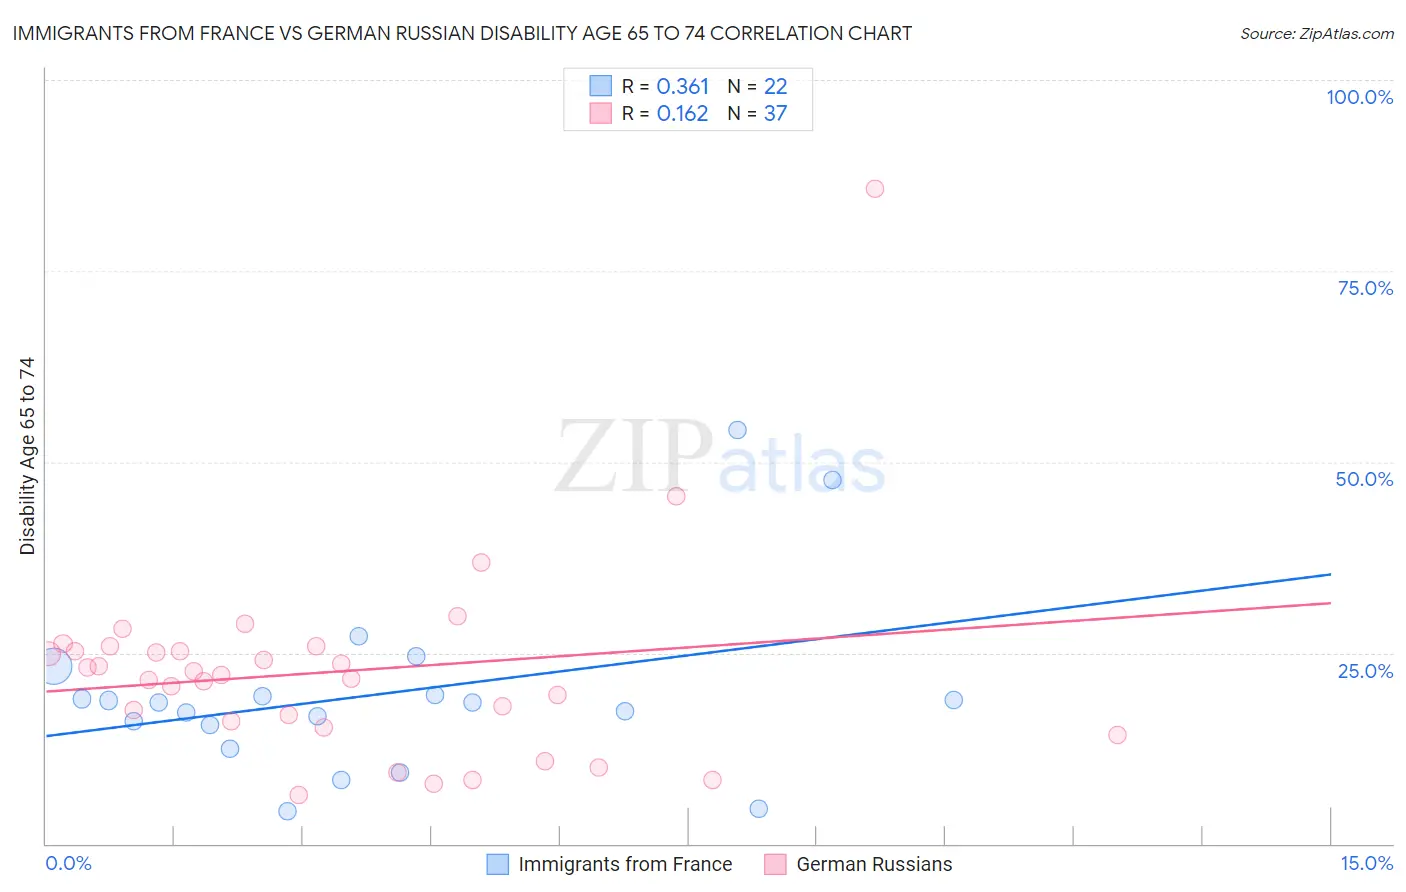
Immigrants from France vs German Russian Disability Age 65 to 74 Correlation Chart
The statistical analysis conducted on geographies consisting of 287,648,161 people shows a mild positive correlation between the proportion of Immigrants from France and percentage of population with a disability between the ages 65 and 75 in the United States with a correlation coefficient (R) of 0.361 and weighted average of 21.5%. Similarly, the statistical analysis conducted on geographies consisting of 96,383,103 people shows a poor positive correlation between the proportion of German Russians and percentage of population with a disability between the ages 65 and 75 in the United States with a correlation coefficient (R) of 0.162 and weighted average of 24.4%, a difference of 13.8%.
Disability Age 65 to 74 Correlation Summary
| Measurement | Immigrants from France | German Russian |
| Minimum | 4.3% | 6.3% |
| Maximum | 54.1% | 85.7% |
| Range | 49.8% | 79.4% |
| Mean | 19.6% | 22.6% |
| Median | 18.5% | 22.1% |
| Interquartile 25% (IQ1) | 15.6% | 15.7% |
| Interquartile 75% (IQ3) | 19.5% | 25.5% |
| Interquartile Range (IQR) | 3.9% | 9.8% |
| Standard Deviation (Sample) | 11.7% | 13.5% |
| Standard Deviation (Population) | 11.4% | 13.3% |
Similar Demographics by Disability Age 65 to 74
Demographics Similar to Immigrants from France by Disability Age 65 to 74
In terms of disability age 65 to 74, the demographic groups most similar to Immigrants from France are Bhutanese (21.5%, a difference of 0.010%), Immigrants from Italy (21.5%, a difference of 0.020%), Immigrants from Romania (21.5%, a difference of 0.090%), Immigrants from Denmark (21.5%, a difference of 0.11%), and Immigrants from Asia (21.5%, a difference of 0.21%).
| Demographics | Rating | Rank | Disability Age 65 to 74 |
| Asians | 99.7 /100 | #45 | Exceptional 21.4% |
| Immigrants | Turkey | 99.7 /100 | #46 | Exceptional 21.4% |
| Immigrants | Bulgaria | 99.7 /100 | #47 | Exceptional 21.4% |
| Lithuanians | 99.7 /100 | #48 | Exceptional 21.4% |
| Luxembourgers | 99.7 /100 | #49 | Exceptional 21.4% |
| Immigrants | Malaysia | 99.7 /100 | #50 | Exceptional 21.4% |
| Immigrants | Serbia | 99.6 /100 | #51 | Exceptional 21.4% |
| Immigrants | France | 99.6 /100 | #52 | Exceptional 21.5% |
| Bhutanese | 99.6 /100 | #53 | Exceptional 21.5% |
| Immigrants | Italy | 99.6 /100 | #54 | Exceptional 21.5% |
| Immigrants | Romania | 99.5 /100 | #55 | Exceptional 21.5% |
| Immigrants | Denmark | 99.5 /100 | #56 | Exceptional 21.5% |
| Immigrants | Asia | 99.5 /100 | #57 | Exceptional 21.5% |
| Immigrants | Pakistan | 99.5 /100 | #58 | Exceptional 21.5% |
| Zimbabweans | 99.5 /100 | #59 | Exceptional 21.5% |
Demographics Similar to German Russians by Disability Age 65 to 74
In terms of disability age 65 to 74, the demographic groups most similar to German Russians are Scotch-Irish (24.4%, a difference of 0.040%), West Indian (24.5%, a difference of 0.10%), Panamanian (24.4%, a difference of 0.19%), Immigrants from Ghana (24.5%, a difference of 0.27%), and Bahamian (24.4%, a difference of 0.30%).
| Demographics | Rating | Rank | Disability Age 65 to 74 |
| Celtics | 6.4 /100 | #229 | Tragic 24.2% |
| Barbadians | 6.0 /100 | #230 | Tragic 24.3% |
| Immigrants | Thailand | 5.2 /100 | #231 | Tragic 24.3% |
| Immigrants | Zaire | 5.0 /100 | #232 | Tragic 24.3% |
| Bahamians | 4.5 /100 | #233 | Tragic 24.4% |
| Panamanians | 4.2 /100 | #234 | Tragic 24.4% |
| Scotch-Irish | 3.8 /100 | #235 | Tragic 24.4% |
| German Russians | 3.7 /100 | #236 | Tragic 24.4% |
| West Indians | 3.4 /100 | #237 | Tragic 24.5% |
| Immigrants | Ghana | 3.0 /100 | #238 | Tragic 24.5% |
| Immigrants | Caribbean | 2.6 /100 | #239 | Tragic 24.6% |
| Spaniards | 2.4 /100 | #240 | Tragic 24.6% |
| Immigrants | Western Africa | 2.3 /100 | #241 | Tragic 24.6% |
| Immigrants | Senegal | 2.2 /100 | #242 | Tragic 24.6% |
| Spanish | 2.2 /100 | #243 | Tragic 24.6% |