Trinidadian and Tobagonian vs German Russian Unemployment Among Seniors over 75 years
COMPARE
Trinidadian and Tobagonian
German Russian
Unemployment Among Seniors over 75 years
Unemployment Among Seniors over 75 years Comparison
Trinidadians and Tobagonians
German Russians
8.3%
UNEMPLOYMENT AMONG SENIORS OVER 75 YEARS
98.4/ 100
METRIC RATING
114th/ 347
METRIC RANK
8.4%
UNEMPLOYMENT AMONG SENIORS OVER 75 YEARS
94.9/ 100
METRIC RATING
131st/ 347
METRIC RANK
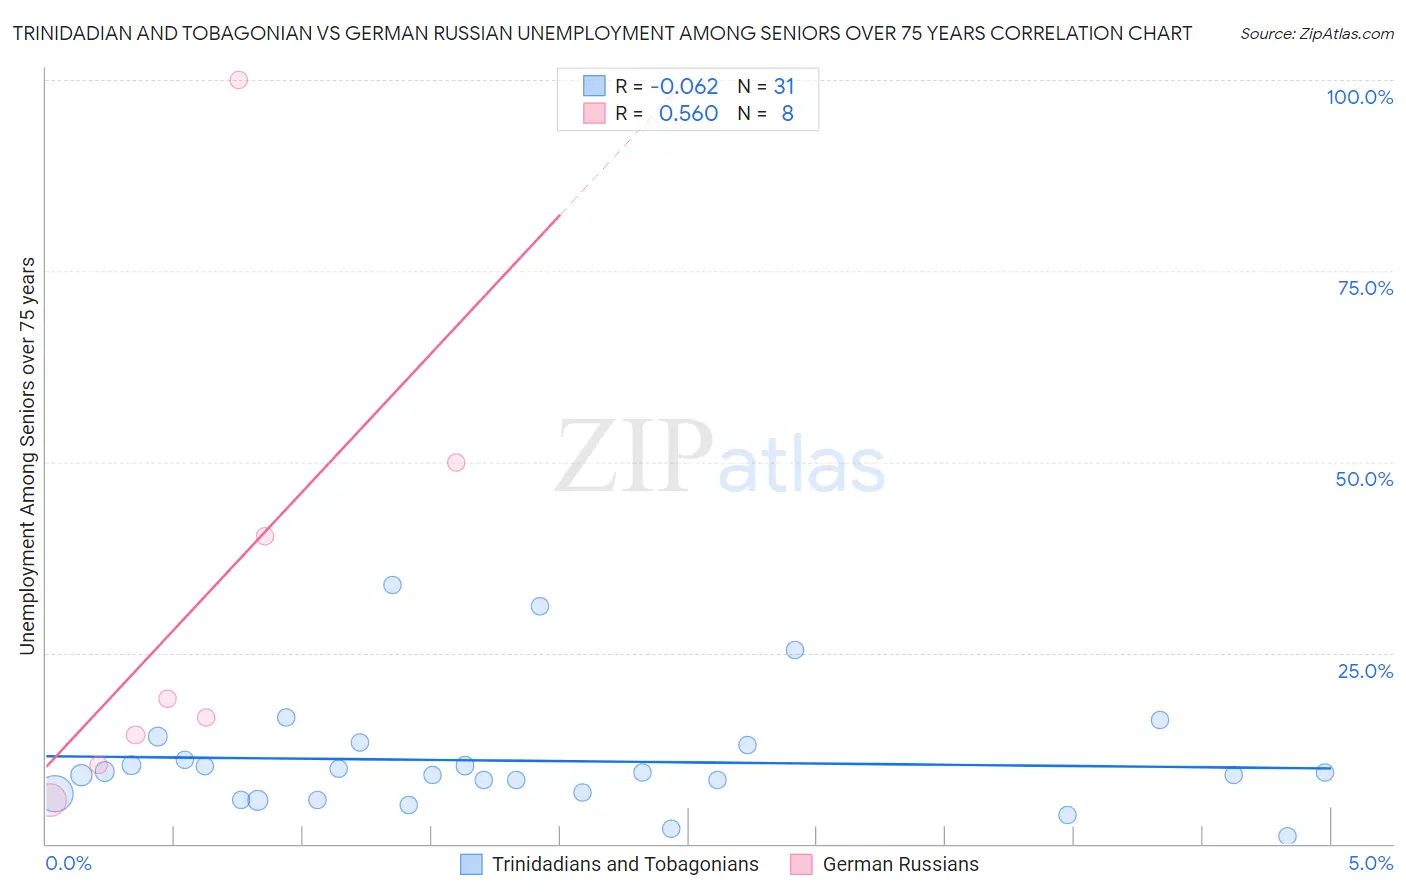
Trinidadian and Tobagonian vs German Russian Unemployment Among Seniors over 75 years Correlation Chart
The statistical analysis conducted on geographies consisting of 137,167,796 people shows a slight negative correlation between the proportion of Trinidadians and Tobagonians and unemployment rate among seniors over the age of 75 in the United States with a correlation coefficient (R) of -0.062 and weighted average of 8.3%. Similarly, the statistical analysis conducted on geographies consisting of 73,268,309 people shows a substantial positive correlation between the proportion of German Russians and unemployment rate among seniors over the age of 75 in the United States with a correlation coefficient (R) of 0.560 and weighted average of 8.4%, a difference of 1.7%.
Unemployment Among Seniors over 75 years Correlation Summary
| Measurement | Trinidadian and Tobagonian | German Russian |
| Minimum | 1.0% | 5.8% |
| Maximum | 33.9% | 100.0% |
| Range | 32.9% | 94.2% |
| Mean | 10.9% | 32.0% |
| Median | 9.3% | 17.8% |
| Interquartile 25% (IQ1) | 6.5% | 12.3% |
| Interquartile 75% (IQ3) | 13.0% | 45.1% |
| Interquartile Range (IQR) | 6.5% | 32.8% |
| Standard Deviation (Sample) | 7.4% | 31.4% |
| Standard Deviation (Population) | 7.3% | 29.4% |
Demographics Similar to Trinidadians and Tobagonians and German Russians by Unemployment Among Seniors over 75 years
In terms of unemployment among seniors over 75 years, the demographic groups most similar to Trinidadians and Tobagonians are Sudanese (8.3%, a difference of 0.12%), Asian (8.3%, a difference of 0.15%), Immigrants from West Indies (8.3%, a difference of 0.19%), Immigrants from India (8.2%, a difference of 0.21%), and Immigrants from Greece (8.3%, a difference of 0.33%). Similarly, the demographic groups most similar to German Russians are Apache (8.4%, a difference of 0.080%), Chilean (8.4%, a difference of 0.28%), Ghanaian (8.4%, a difference of 0.36%), Native Hawaiian (8.4%, a difference of 0.39%), and Honduran (8.4%, a difference of 0.44%).
| Demographics | Rating | Rank | Unemployment Among Seniors over 75 years |
| Immigrants | India | 98.6 /100 | #112 | Exceptional 8.2% |
| Asians | 98.5 /100 | #113 | Exceptional 8.3% |
| Trinidadians and Tobagonians | 98.4 /100 | #114 | Exceptional 8.3% |
| Sudanese | 98.2 /100 | #115 | Exceptional 8.3% |
| Immigrants | West Indies | 98.1 /100 | #116 | Exceptional 8.3% |
| Immigrants | Greece | 97.9 /100 | #117 | Exceptional 8.3% |
| Immigrants | Middle Africa | 97.9 /100 | #118 | Exceptional 8.3% |
| Japanese | 97.5 /100 | #119 | Exceptional 8.3% |
| Immigrants | Asia | 97.4 /100 | #120 | Exceptional 8.3% |
| Immigrants | Croatia | 97.2 /100 | #121 | Exceptional 8.3% |
| Immigrants | Russia | 97.1 /100 | #122 | Exceptional 8.3% |
| Immigrants | Nepal | 96.9 /100 | #123 | Exceptional 8.3% |
| Thais | 96.8 /100 | #124 | Exceptional 8.3% |
| Immigrants | Moldova | 96.7 /100 | #125 | Exceptional 8.3% |
| Belizeans | 96.3 /100 | #126 | Exceptional 8.4% |
| Hondurans | 96.2 /100 | #127 | Exceptional 8.4% |
| Native Hawaiians | 96.1 /100 | #128 | Exceptional 8.4% |
| Ghanaians | 96.0 /100 | #129 | Exceptional 8.4% |
| Apache | 95.2 /100 | #130 | Exceptional 8.4% |
| German Russians | 94.9 /100 | #131 | Exceptional 8.4% |
| Chileans | 93.8 /100 | #132 | Exceptional 8.4% |