Immigrants from Fiji vs German Russian Disability Age 65 to 74
COMPARE
Immigrants from Fiji
German Russian
Disability Age 65 to 74
Disability Age 65 to 74 Comparison
Immigrants from Fiji
German Russians
25.0%
DISABILITY AGE 65 TO 74
0.8/ 100
METRIC RATING
249th/ 347
METRIC RANK
24.4%
DISABILITY AGE 65 TO 74
3.7/ 100
METRIC RATING
236th/ 347
METRIC RANK
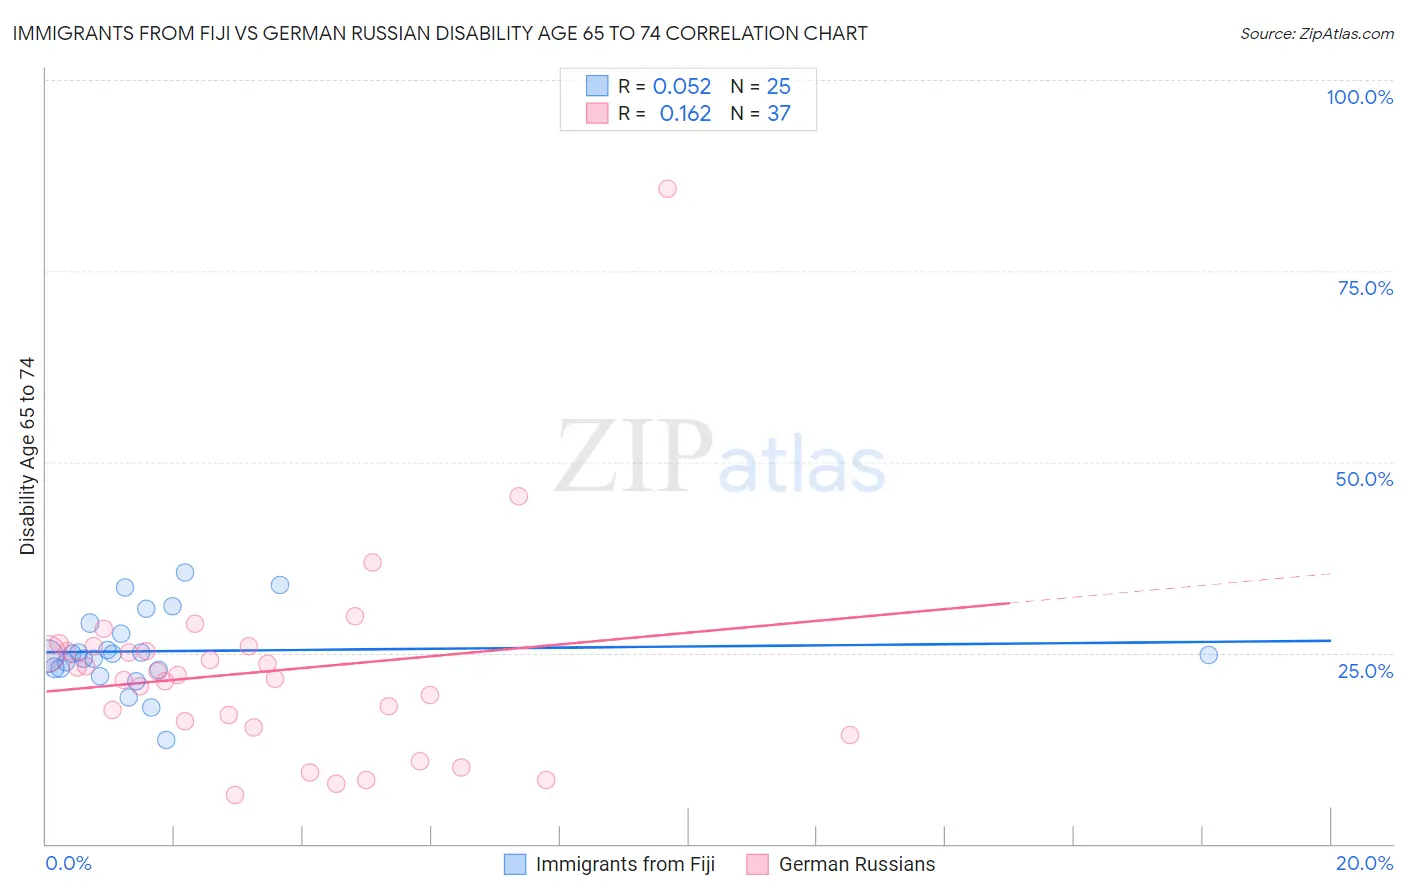
Immigrants from Fiji vs German Russian Disability Age 65 to 74 Correlation Chart
The statistical analysis conducted on geographies consisting of 93,725,499 people shows a slight positive correlation between the proportion of Immigrants from Fiji and percentage of population with a disability between the ages 65 and 75 in the United States with a correlation coefficient (R) of 0.052 and weighted average of 25.0%. Similarly, the statistical analysis conducted on geographies consisting of 96,383,103 people shows a poor positive correlation between the proportion of German Russians and percentage of population with a disability between the ages 65 and 75 in the United States with a correlation coefficient (R) of 0.162 and weighted average of 24.4%, a difference of 2.1%.
Disability Age 65 to 74 Correlation Summary
| Measurement | Immigrants from Fiji | German Russian |
| Minimum | 13.6% | 6.3% |
| Maximum | 35.4% | 85.7% |
| Range | 21.9% | 79.4% |
| Mean | 25.2% | 22.6% |
| Median | 24.7% | 22.1% |
| Interquartile 25% (IQ1) | 22.9% | 15.7% |
| Interquartile 75% (IQ3) | 28.2% | 25.5% |
| Interquartile Range (IQR) | 5.3% | 9.8% |
| Standard Deviation (Sample) | 5.0% | 13.5% |
| Standard Deviation (Population) | 4.9% | 13.3% |
Demographics Similar to Immigrants from Fiji and German Russians by Disability Age 65 to 74
In terms of disability age 65 to 74, the demographic groups most similar to Immigrants from Fiji are Salvadoran (25.0%, a difference of 0.020%), Senegalese (24.9%, a difference of 0.10%), Nonimmigrants (25.0%, a difference of 0.22%), Indonesian (24.9%, a difference of 0.36%), and Immigrants from El Salvador (25.1%, a difference of 0.41%). Similarly, the demographic groups most similar to German Russians are Scotch-Irish (24.4%, a difference of 0.040%), West Indian (24.5%, a difference of 0.10%), Panamanian (24.4%, a difference of 0.19%), Immigrants from Ghana (24.5%, a difference of 0.27%), and Bahamian (24.4%, a difference of 0.30%).
| Demographics | Rating | Rank | Disability Age 65 to 74 |
| Immigrants | Zaire | 5.0 /100 | #232 | Tragic 24.3% |
| Bahamians | 4.5 /100 | #233 | Tragic 24.4% |
| Panamanians | 4.2 /100 | #234 | Tragic 24.4% |
| Scotch-Irish | 3.8 /100 | #235 | Tragic 24.4% |
| German Russians | 3.7 /100 | #236 | Tragic 24.4% |
| West Indians | 3.4 /100 | #237 | Tragic 24.5% |
| Immigrants | Ghana | 3.0 /100 | #238 | Tragic 24.5% |
| Immigrants | Caribbean | 2.6 /100 | #239 | Tragic 24.6% |
| Spaniards | 2.4 /100 | #240 | Tragic 24.6% |
| Immigrants | Western Africa | 2.3 /100 | #241 | Tragic 24.6% |
| Immigrants | Senegal | 2.2 /100 | #242 | Tragic 24.6% |
| Spanish | 2.2 /100 | #243 | Tragic 24.6% |
| Armenians | 2.0 /100 | #244 | Tragic 24.7% |
| British West Indians | 2.0 /100 | #245 | Tragic 24.7% |
| Immigrants | Iraq | 1.9 /100 | #246 | Tragic 24.7% |
| Indonesians | 1.1 /100 | #247 | Tragic 24.9% |
| Senegalese | 0.9 /100 | #248 | Tragic 24.9% |
| Immigrants | Fiji | 0.8 /100 | #249 | Tragic 25.0% |
| Salvadorans | 0.8 /100 | #250 | Tragic 25.0% |
| Immigrants | Nonimmigrants | 0.7 /100 | #251 | Tragic 25.0% |
| Immigrants | El Salvador | 0.6 /100 | #252 | Tragic 25.1% |