Immigrants from Dominica vs German Russian Disability Age 65 to 74
COMPARE
Immigrants from Dominica
German Russian
Disability Age 65 to 74
Disability Age 65 to 74 Comparison
Immigrants from Dominica
German Russians
25.7%
DISABILITY AGE 65 TO 74
0.1/ 100
METRIC RATING
272nd/ 347
METRIC RANK
24.4%
DISABILITY AGE 65 TO 74
3.7/ 100
METRIC RATING
236th/ 347
METRIC RANK
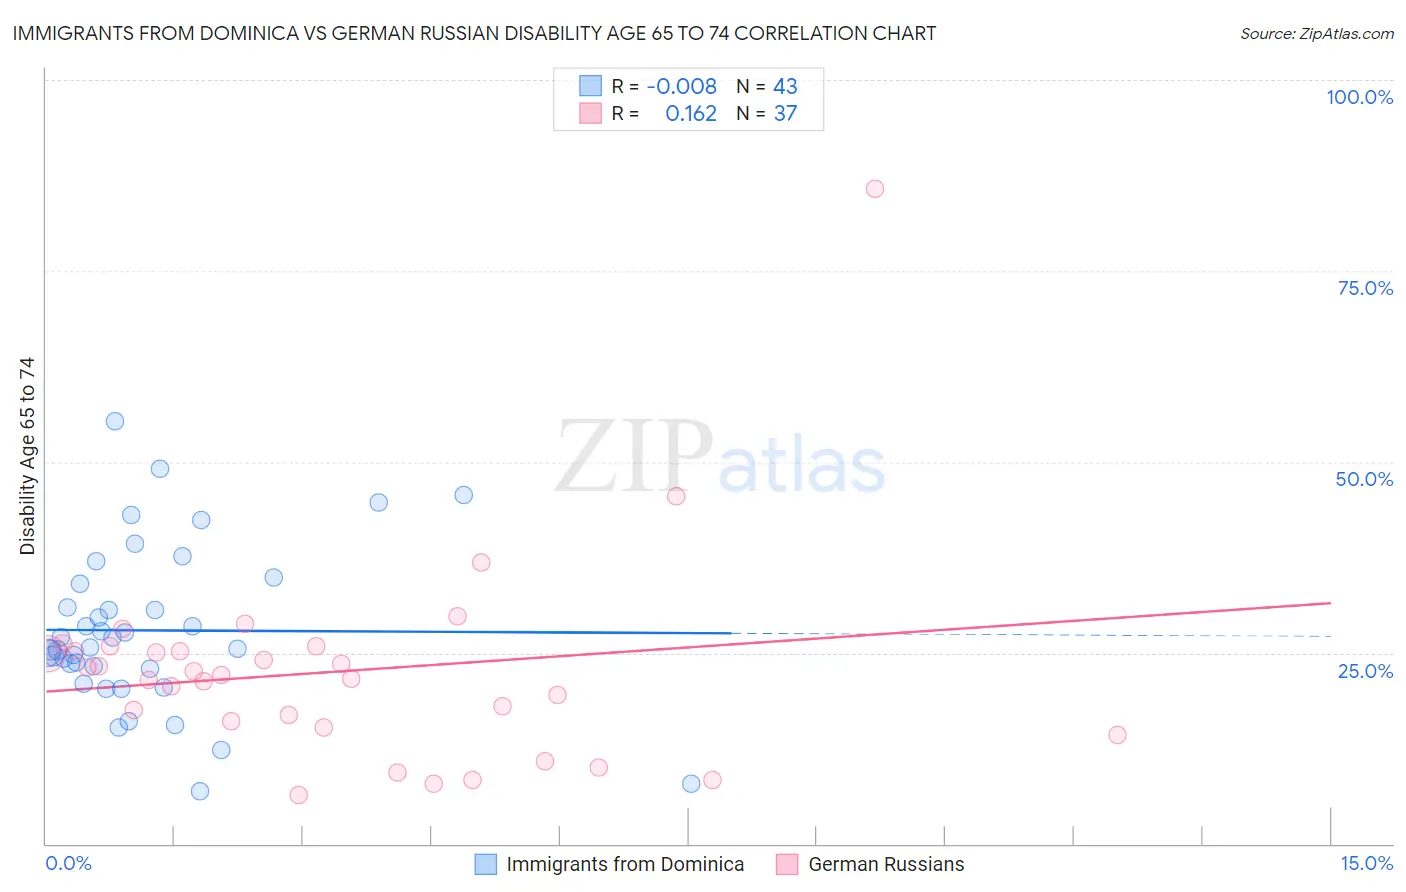
Immigrants from Dominica vs German Russian Disability Age 65 to 74 Correlation Chart
The statistical analysis conducted on geographies consisting of 83,763,598 people shows no correlation between the proportion of Immigrants from Dominica and percentage of population with a disability between the ages 65 and 75 in the United States with a correlation coefficient (R) of -0.008 and weighted average of 25.7%. Similarly, the statistical analysis conducted on geographies consisting of 96,383,103 people shows a poor positive correlation between the proportion of German Russians and percentage of population with a disability between the ages 65 and 75 in the United States with a correlation coefficient (R) of 0.162 and weighted average of 24.4%, a difference of 5.1%.
Disability Age 65 to 74 Correlation Summary
| Measurement | Immigrants from Dominica | German Russian |
| Minimum | 6.9% | 6.3% |
| Maximum | 55.3% | 85.7% |
| Range | 48.4% | 79.4% |
| Mean | 27.9% | 22.6% |
| Median | 25.7% | 22.1% |
| Interquartile 25% (IQ1) | 22.9% | 15.7% |
| Interquartile 75% (IQ3) | 34.1% | 25.5% |
| Interquartile Range (IQR) | 11.3% | 9.8% |
| Standard Deviation (Sample) | 10.4% | 13.5% |
| Standard Deviation (Population) | 10.3% | 13.3% |
Similar Demographics by Disability Age 65 to 74
Demographics Similar to Immigrants from Dominica by Disability Age 65 to 74
In terms of disability age 65 to 74, the demographic groups most similar to Immigrants from Dominica are Immigrants from Liberia (25.7%, a difference of 0.0%), Immigrants from Guatemala (25.7%, a difference of 0.030%), Hmong (25.7%, a difference of 0.11%), Japanese (25.7%, a difference of 0.13%), and Liberian (25.6%, a difference of 0.23%).
| Demographics | Rating | Rank | Disability Age 65 to 74 |
| Guatemalans | 0.2 /100 | #265 | Tragic 25.5% |
| Immigrants | Latin America | 0.1 /100 | #266 | Tragic 25.6% |
| Ottawa | 0.1 /100 | #267 | Tragic 25.6% |
| Liberians | 0.1 /100 | #268 | Tragic 25.6% |
| Hmong | 0.1 /100 | #269 | Tragic 25.7% |
| Immigrants | Guatemala | 0.1 /100 | #270 | Tragic 25.7% |
| Immigrants | Liberia | 0.1 /100 | #271 | Tragic 25.7% |
| Immigrants | Dominica | 0.1 /100 | #272 | Tragic 25.7% |
| Japanese | 0.1 /100 | #273 | Tragic 25.7% |
| Americans | 0.1 /100 | #274 | Tragic 25.8% |
| Hondurans | 0.1 /100 | #275 | Tragic 25.8% |
| French American Indians | 0.1 /100 | #276 | Tragic 25.8% |
| Belizeans | 0.1 /100 | #277 | Tragic 25.8% |
| Immigrants | Belize | 0.1 /100 | #278 | Tragic 25.8% |
| U.S. Virgin Islanders | 0.1 /100 | #279 | Tragic 25.9% |
Demographics Similar to German Russians by Disability Age 65 to 74
In terms of disability age 65 to 74, the demographic groups most similar to German Russians are Scotch-Irish (24.4%, a difference of 0.040%), West Indian (24.5%, a difference of 0.10%), Panamanian (24.4%, a difference of 0.19%), Immigrants from Ghana (24.5%, a difference of 0.27%), and Bahamian (24.4%, a difference of 0.30%).
| Demographics | Rating | Rank | Disability Age 65 to 74 |
| Celtics | 6.4 /100 | #229 | Tragic 24.2% |
| Barbadians | 6.0 /100 | #230 | Tragic 24.3% |
| Immigrants | Thailand | 5.2 /100 | #231 | Tragic 24.3% |
| Immigrants | Zaire | 5.0 /100 | #232 | Tragic 24.3% |
| Bahamians | 4.5 /100 | #233 | Tragic 24.4% |
| Panamanians | 4.2 /100 | #234 | Tragic 24.4% |
| Scotch-Irish | 3.8 /100 | #235 | Tragic 24.4% |
| German Russians | 3.7 /100 | #236 | Tragic 24.4% |
| West Indians | 3.4 /100 | #237 | Tragic 24.5% |
| Immigrants | Ghana | 3.0 /100 | #238 | Tragic 24.5% |
| Immigrants | Caribbean | 2.6 /100 | #239 | Tragic 24.6% |
| Spaniards | 2.4 /100 | #240 | Tragic 24.6% |
| Immigrants | Western Africa | 2.3 /100 | #241 | Tragic 24.6% |
| Immigrants | Senegal | 2.2 /100 | #242 | Tragic 24.6% |
| Spanish | 2.2 /100 | #243 | Tragic 24.6% |