Tongan vs Sierra Leonean Disability Age Under 5
COMPARE
Tongan
Sierra Leonean
Disability Age Under 5
Disability Age Under 5 Comparison
Tongans
Sierra Leoneans
1.3%
DISABILITY AGE UNDER 5
4.2/ 100
METRIC RATING
233rd/ 347
METRIC RANK
1.2%
DISABILITY AGE UNDER 5
59.1/ 100
METRIC RATING
168th/ 347
METRIC RANK
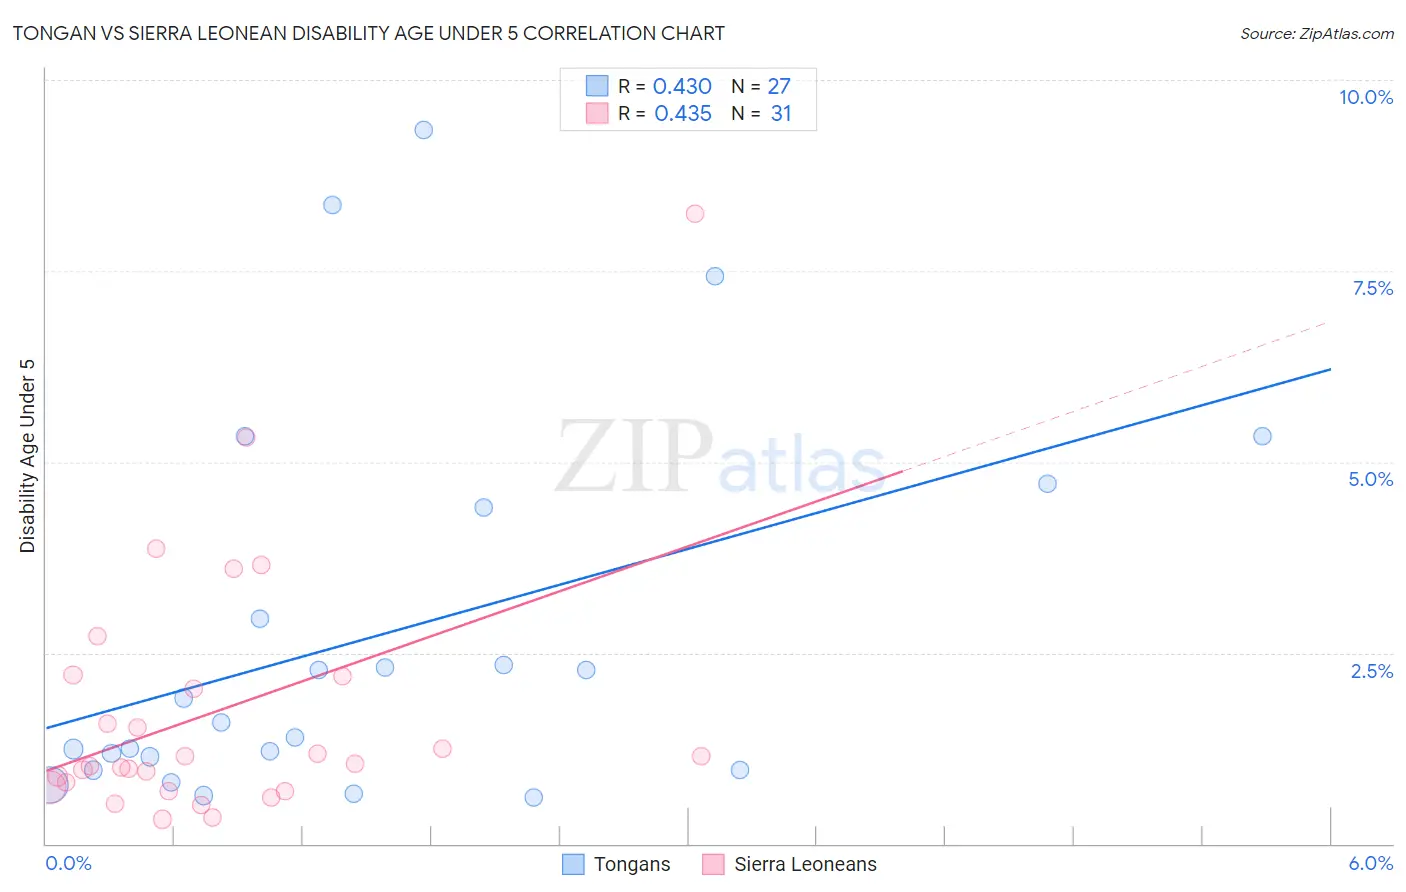
Tongan vs Sierra Leonean Disability Age Under 5 Correlation Chart
The statistical analysis conducted on geographies consisting of 77,388,700 people shows a moderate positive correlation between the proportion of Tongans and percentage of population with a disability under the age of 5 in the United States with a correlation coefficient (R) of 0.430 and weighted average of 1.3%. Similarly, the statistical analysis conducted on geographies consisting of 65,429,167 people shows a moderate positive correlation between the proportion of Sierra Leoneans and percentage of population with a disability under the age of 5 in the United States with a correlation coefficient (R) of 0.435 and weighted average of 1.2%, a difference of 8.0%.
Disability Age Under 5 Correlation Summary
| Measurement | Tongan | Sierra Leonean |
| Minimum | 0.61% | 0.32% |
| Maximum | 9.3% | 8.2% |
| Range | 8.7% | 7.9% |
| Mean | 2.7% | 1.7% |
| Median | 1.6% | 1.0% |
| Interquartile 25% (IQ1) | 0.97% | 0.74% |
| Interquartile 75% (IQ3) | 4.4% | 2.2% |
| Interquartile Range (IQR) | 3.4% | 1.5% |
| Standard Deviation (Sample) | 2.5% | 1.7% |
| Standard Deviation (Population) | 2.4% | 1.7% |
Similar Demographics by Disability Age Under 5
Demographics Similar to Tongans by Disability Age Under 5
In terms of disability age under 5, the demographic groups most similar to Tongans are French American Indian (1.3%, a difference of 0.12%), Immigrants from Northern Europe (1.3%, a difference of 0.25%), Pueblo (1.3%, a difference of 0.26%), Central American Indian (1.3%, a difference of 0.33%), and Lebanese (1.3%, a difference of 0.49%).
| Demographics | Rating | Rank | Disability Age Under 5 |
| Bahamians | 7.1 /100 | #226 | Tragic 1.3% |
| Taiwanese | 6.1 /100 | #227 | Tragic 1.3% |
| Luxembourgers | 6.1 /100 | #228 | Tragic 1.3% |
| Immigrants | Costa Rica | 5.5 /100 | #229 | Tragic 1.3% |
| Lebanese | 5.3 /100 | #230 | Tragic 1.3% |
| Immigrants | Northern Europe | 4.7 /100 | #231 | Tragic 1.3% |
| French American Indians | 4.5 /100 | #232 | Tragic 1.3% |
| Tongans | 4.2 /100 | #233 | Tragic 1.3% |
| Pueblo | 3.8 /100 | #234 | Tragic 1.3% |
| Central American Indians | 3.6 /100 | #235 | Tragic 1.3% |
| South American Indians | 3.3 /100 | #236 | Tragic 1.3% |
| Basques | 3.0 /100 | #237 | Tragic 1.3% |
| Spanish American Indians | 2.4 /100 | #238 | Tragic 1.3% |
| Immigrants | Austria | 2.3 /100 | #239 | Tragic 1.3% |
| Native Hawaiians | 2.2 /100 | #240 | Tragic 1.3% |
Demographics Similar to Sierra Leoneans by Disability Age Under 5
In terms of disability age under 5, the demographic groups most similar to Sierra Leoneans are Immigrants from Uruguay (1.2%, a difference of 0.010%), Immigrants from Jamaica (1.2%, a difference of 0.030%), Immigrants from Argentina (1.2%, a difference of 0.11%), Guamanian/Chamorro (1.2%, a difference of 0.12%), and Immigrants from Central America (1.2%, a difference of 0.22%).
| Demographics | Rating | Rank | Disability Age Under 5 |
| Immigrants | Africa | 65.1 /100 | #161 | Good 1.2% |
| Guatemalans | 63.6 /100 | #162 | Good 1.2% |
| Immigrants | Guatemala | 63.2 /100 | #163 | Good 1.2% |
| Laotians | 62.8 /100 | #164 | Good 1.2% |
| Immigrants | Kuwait | 62.6 /100 | #165 | Good 1.2% |
| Immigrants | Central America | 61.4 /100 | #166 | Good 1.2% |
| Immigrants | Argentina | 60.2 /100 | #167 | Good 1.2% |
| Sierra Leoneans | 59.1 /100 | #168 | Average 1.2% |
| Immigrants | Uruguay | 59.0 /100 | #169 | Average 1.2% |
| Immigrants | Jamaica | 58.8 /100 | #170 | Average 1.2% |
| Guamanians/Chamorros | 57.8 /100 | #171 | Average 1.2% |
| Crow | 51.0 /100 | #172 | Average 1.2% |
| Immigrants | Ireland | 50.3 /100 | #173 | Average 1.2% |
| Immigrants | Latvia | 50.0 /100 | #174 | Average 1.2% |
| Immigrants | Nigeria | 50.0 /100 | #175 | Average 1.2% |