Tongan vs Immigrants from Oceania Disability Age Under 5
COMPARE
Tongan
Immigrants from Oceania
Disability Age Under 5
Disability Age Under 5 Comparison
Tongans
Immigrants from Oceania
1.3%
DISABILITY AGE UNDER 5
4.2/ 100
METRIC RATING
233rd/ 347
METRIC RANK
1.2%
DISABILITY AGE UNDER 5
94.2/ 100
METRIC RATING
113th/ 347
METRIC RANK
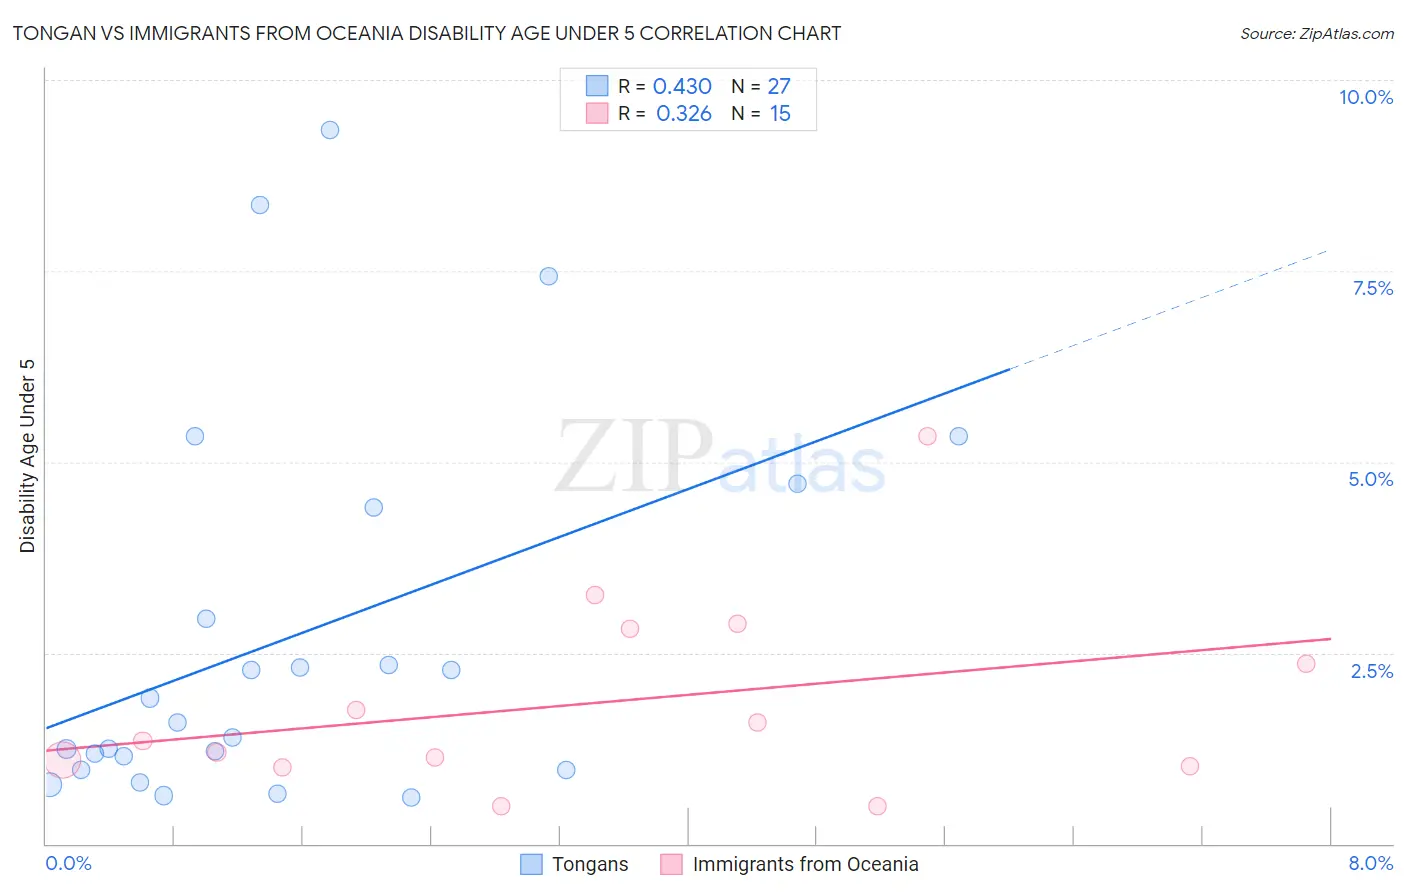
Tongan vs Immigrants from Oceania Disability Age Under 5 Correlation Chart
The statistical analysis conducted on geographies consisting of 77,388,700 people shows a moderate positive correlation between the proportion of Tongans and percentage of population with a disability under the age of 5 in the United States with a correlation coefficient (R) of 0.430 and weighted average of 1.3%. Similarly, the statistical analysis conducted on geographies consisting of 180,365,611 people shows a mild positive correlation between the proportion of Immigrants from Oceania and percentage of population with a disability under the age of 5 in the United States with a correlation coefficient (R) of 0.326 and weighted average of 1.2%, a difference of 14.3%.
Disability Age Under 5 Correlation Summary
| Measurement | Tongan | Immigrants from Oceania |
| Minimum | 0.61% | 0.49% |
| Maximum | 9.3% | 5.3% |
| Range | 8.7% | 4.9% |
| Mean | 2.7% | 1.9% |
| Median | 1.6% | 1.3% |
| Interquartile 25% (IQ1) | 0.97% | 1.0% |
| Interquartile 75% (IQ3) | 4.4% | 2.8% |
| Interquartile Range (IQR) | 3.4% | 1.8% |
| Standard Deviation (Sample) | 2.5% | 1.3% |
| Standard Deviation (Population) | 2.4% | 1.2% |
Similar Demographics by Disability Age Under 5
Demographics Similar to Tongans by Disability Age Under 5
In terms of disability age under 5, the demographic groups most similar to Tongans are French American Indian (1.3%, a difference of 0.12%), Immigrants from Northern Europe (1.3%, a difference of 0.25%), Pueblo (1.3%, a difference of 0.26%), Central American Indian (1.3%, a difference of 0.33%), and Lebanese (1.3%, a difference of 0.49%).
| Demographics | Rating | Rank | Disability Age Under 5 |
| Bahamians | 7.1 /100 | #226 | Tragic 1.3% |
| Taiwanese | 6.1 /100 | #227 | Tragic 1.3% |
| Luxembourgers | 6.1 /100 | #228 | Tragic 1.3% |
| Immigrants | Costa Rica | 5.5 /100 | #229 | Tragic 1.3% |
| Lebanese | 5.3 /100 | #230 | Tragic 1.3% |
| Immigrants | Northern Europe | 4.7 /100 | #231 | Tragic 1.3% |
| French American Indians | 4.5 /100 | #232 | Tragic 1.3% |
| Tongans | 4.2 /100 | #233 | Tragic 1.3% |
| Pueblo | 3.8 /100 | #234 | Tragic 1.3% |
| Central American Indians | 3.6 /100 | #235 | Tragic 1.3% |
| South American Indians | 3.3 /100 | #236 | Tragic 1.3% |
| Basques | 3.0 /100 | #237 | Tragic 1.3% |
| Spanish American Indians | 2.4 /100 | #238 | Tragic 1.3% |
| Immigrants | Austria | 2.3 /100 | #239 | Tragic 1.3% |
| Native Hawaiians | 2.2 /100 | #240 | Tragic 1.3% |
Demographics Similar to Immigrants from Oceania by Disability Age Under 5
In terms of disability age under 5, the demographic groups most similar to Immigrants from Oceania are Immigrants from Australia (1.2%, a difference of 0.060%), Belizean (1.2%, a difference of 0.15%), Immigrants from Caribbean (1.2%, a difference of 0.16%), Senegalese (1.2%, a difference of 0.17%), and Immigrants from Northern Africa (1.2%, a difference of 0.18%).
| Demographics | Rating | Rank | Disability Age Under 5 |
| Cambodians | 95.4 /100 | #106 | Exceptional 1.2% |
| Immigrants | West Indies | 95.3 /100 | #107 | Exceptional 1.2% |
| Iraqis | 95.1 /100 | #108 | Exceptional 1.2% |
| Immigrants | Panama | 95.0 /100 | #109 | Exceptional 1.2% |
| Immigrants | Lebanon | 95.0 /100 | #110 | Exceptional 1.2% |
| Senegalese | 94.6 /100 | #111 | Exceptional 1.2% |
| Immigrants | Australia | 94.4 /100 | #112 | Exceptional 1.2% |
| Immigrants | Oceania | 94.2 /100 | #113 | Exceptional 1.2% |
| Belizeans | 93.9 /100 | #114 | Exceptional 1.2% |
| Immigrants | Caribbean | 93.8 /100 | #115 | Exceptional 1.2% |
| Immigrants | Northern Africa | 93.8 /100 | #116 | Exceptional 1.2% |
| Immigrants | Philippines | 93.5 /100 | #117 | Exceptional 1.2% |
| Immigrants | Venezuela | 93.4 /100 | #118 | Exceptional 1.2% |
| Bhutanese | 92.5 /100 | #119 | Exceptional 1.2% |
| Immigrants | Eritrea | 92.3 /100 | #120 | Exceptional 1.2% |