Central American Indian vs Immigrants from Cabo Verde Female Disability
COMPARE
Central American Indian
Immigrants from Cabo Verde
Female Disability
Female Disability Comparison
Central American Indians
Immigrants from Cabo Verde
13.6%
FEMALE DISABILITY
0.0/ 100
METRIC RATING
307th/ 347
METRIC RANK
14.6%
FEMALE DISABILITY
0.0/ 100
METRIC RATING
331st/ 347
METRIC RANK
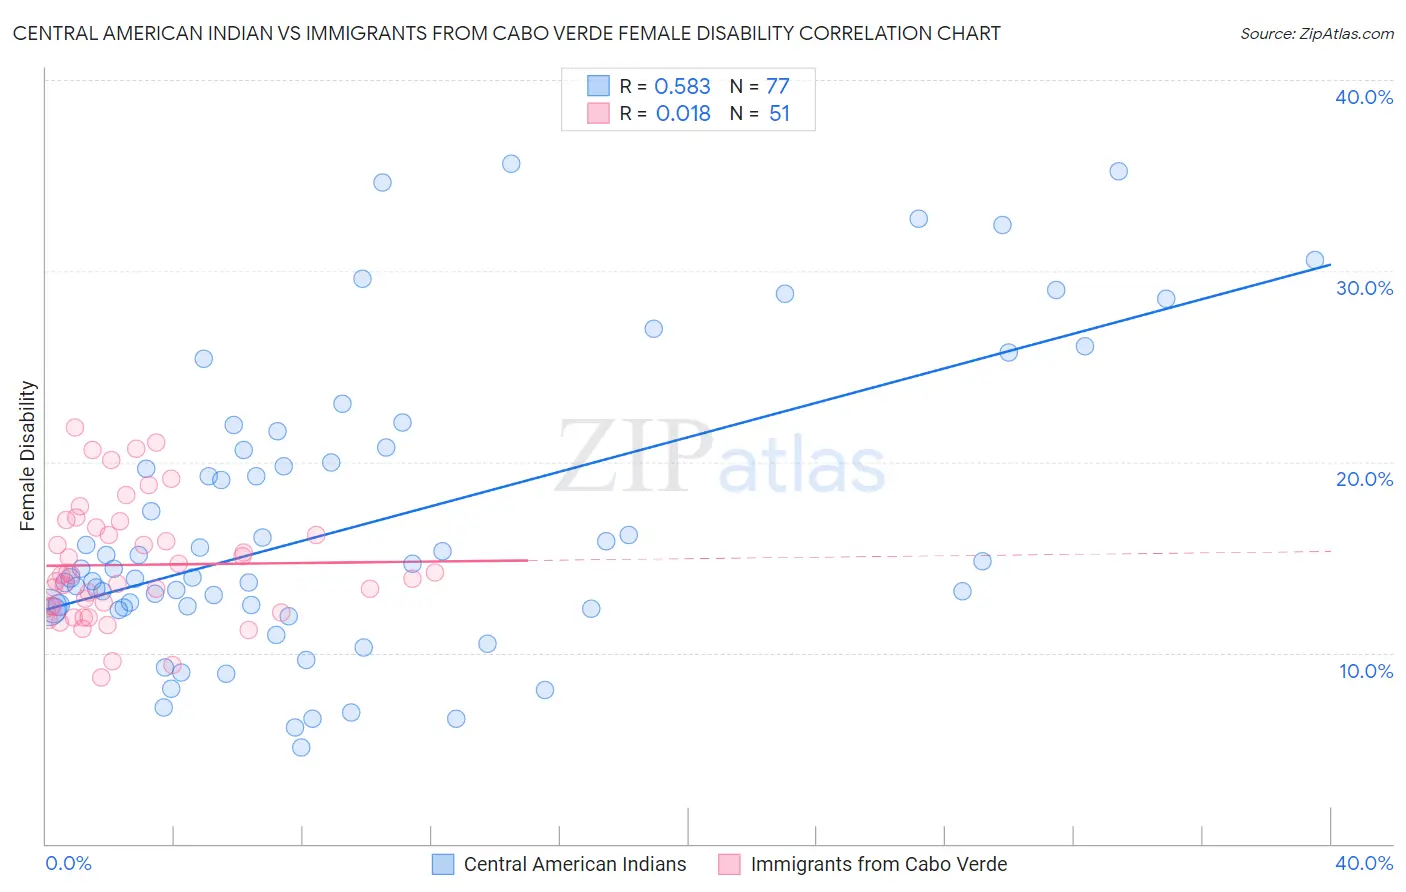
Central American Indian vs Immigrants from Cabo Verde Female Disability Correlation Chart
The statistical analysis conducted on geographies consisting of 326,112,462 people shows a substantial positive correlation between the proportion of Central American Indians and percentage of females with a disability in the United States with a correlation coefficient (R) of 0.583 and weighted average of 13.6%. Similarly, the statistical analysis conducted on geographies consisting of 38,139,523 people shows no correlation between the proportion of Immigrants from Cabo Verde and percentage of females with a disability in the United States with a correlation coefficient (R) of 0.018 and weighted average of 14.6%, a difference of 6.9%.
Female Disability Correlation Summary
| Measurement | Central American Indian | Immigrants from Cabo Verde |
| Minimum | 5.1% | 8.7% |
| Maximum | 35.6% | 21.8% |
| Range | 30.5% | 13.1% |
| Mean | 16.8% | 14.6% |
| Median | 14.4% | 14.1% |
| Interquartile 25% (IQ1) | 12.3% | 12.4% |
| Interquartile 75% (IQ3) | 20.7% | 16.6% |
| Interquartile Range (IQR) | 8.3% | 4.2% |
| Standard Deviation (Sample) | 7.6% | 3.1% |
| Standard Deviation (Population) | 7.5% | 3.1% |
Similar Demographics by Female Disability
Demographics Similar to Central American Indians by Female Disability
In terms of female disability, the demographic groups most similar to Central American Indians are French Canadian (13.6%, a difference of 0.29%), Cree (13.7%, a difference of 0.46%), French American Indian (13.7%, a difference of 0.52%), Apache (13.7%, a difference of 0.63%), and Dominican (13.5%, a difference of 0.92%).
| Demographics | Rating | Rank | Female Disability |
| Pennsylvania Germans | 0.0 /100 | #300 | Tragic 13.4% |
| Africans | 0.0 /100 | #301 | Tragic 13.4% |
| Scotch-Irish | 0.0 /100 | #302 | Tragic 13.4% |
| Immigrants | Portugal | 0.0 /100 | #303 | Tragic 13.5% |
| Immigrants | Micronesia | 0.0 /100 | #304 | Tragic 13.5% |
| Dominicans | 0.0 /100 | #305 | Tragic 13.5% |
| French Canadians | 0.0 /100 | #306 | Tragic 13.6% |
| Central American Indians | 0.0 /100 | #307 | Tragic 13.6% |
| Cree | 0.0 /100 | #308 | Tragic 13.7% |
| French American Indians | 0.0 /100 | #309 | Tragic 13.7% |
| Apache | 0.0 /100 | #310 | Tragic 13.7% |
| Hopi | 0.0 /100 | #311 | Tragic 13.7% |
| Delaware | 0.0 /100 | #312 | Tragic 13.8% |
| Blackfeet | 0.0 /100 | #313 | Tragic 13.8% |
| Puget Sound Salish | 0.0 /100 | #314 | Tragic 13.8% |
Demographics Similar to Immigrants from Cabo Verde by Female Disability
In terms of female disability, the demographic groups most similar to Immigrants from Cabo Verde are Yuman (14.5%, a difference of 0.42%), Pima (14.8%, a difference of 1.6%), Osage (14.3%, a difference of 1.8%), Immigrants from the Azores (14.9%, a difference of 2.0%), and Cherokee (14.9%, a difference of 2.1%).
| Demographics | Rating | Rank | Female Disability |
| Natives/Alaskans | 0.0 /100 | #324 | Tragic 14.1% |
| Navajo | 0.0 /100 | #325 | Tragic 14.2% |
| Comanche | 0.0 /100 | #326 | Tragic 14.2% |
| Ottawa | 0.0 /100 | #327 | Tragic 14.2% |
| Cape Verdeans | 0.0 /100 | #328 | Tragic 14.2% |
| Osage | 0.0 /100 | #329 | Tragic 14.3% |
| Yuman | 0.0 /100 | #330 | Tragic 14.5% |
| Immigrants | Cabo Verde | 0.0 /100 | #331 | Tragic 14.6% |
| Pima | 0.0 /100 | #332 | Tragic 14.8% |
| Immigrants | Azores | 0.0 /100 | #333 | Tragic 14.9% |
| Cherokee | 0.0 /100 | #334 | Tragic 14.9% |
| Cajuns | 0.0 /100 | #335 | Tragic 14.9% |
| Seminole | 0.0 /100 | #336 | Tragic 15.0% |
| Tohono O'odham | 0.0 /100 | #337 | Tragic 15.0% |
| Dutch West Indians | 0.0 /100 | #338 | Tragic 15.0% |