Tongan vs Immigrants from Zaire Female Disability
COMPARE
Tongan
Immigrants from Zaire
Female Disability
Female Disability Comparison
Tongans
Immigrants from Zaire
11.3%
FEMALE DISABILITY
100.0/ 100
METRIC RATING
49th/ 347
METRIC RANK
12.3%
FEMALE DISABILITY
20.9/ 100
METRIC RATING
204th/ 347
METRIC RANK
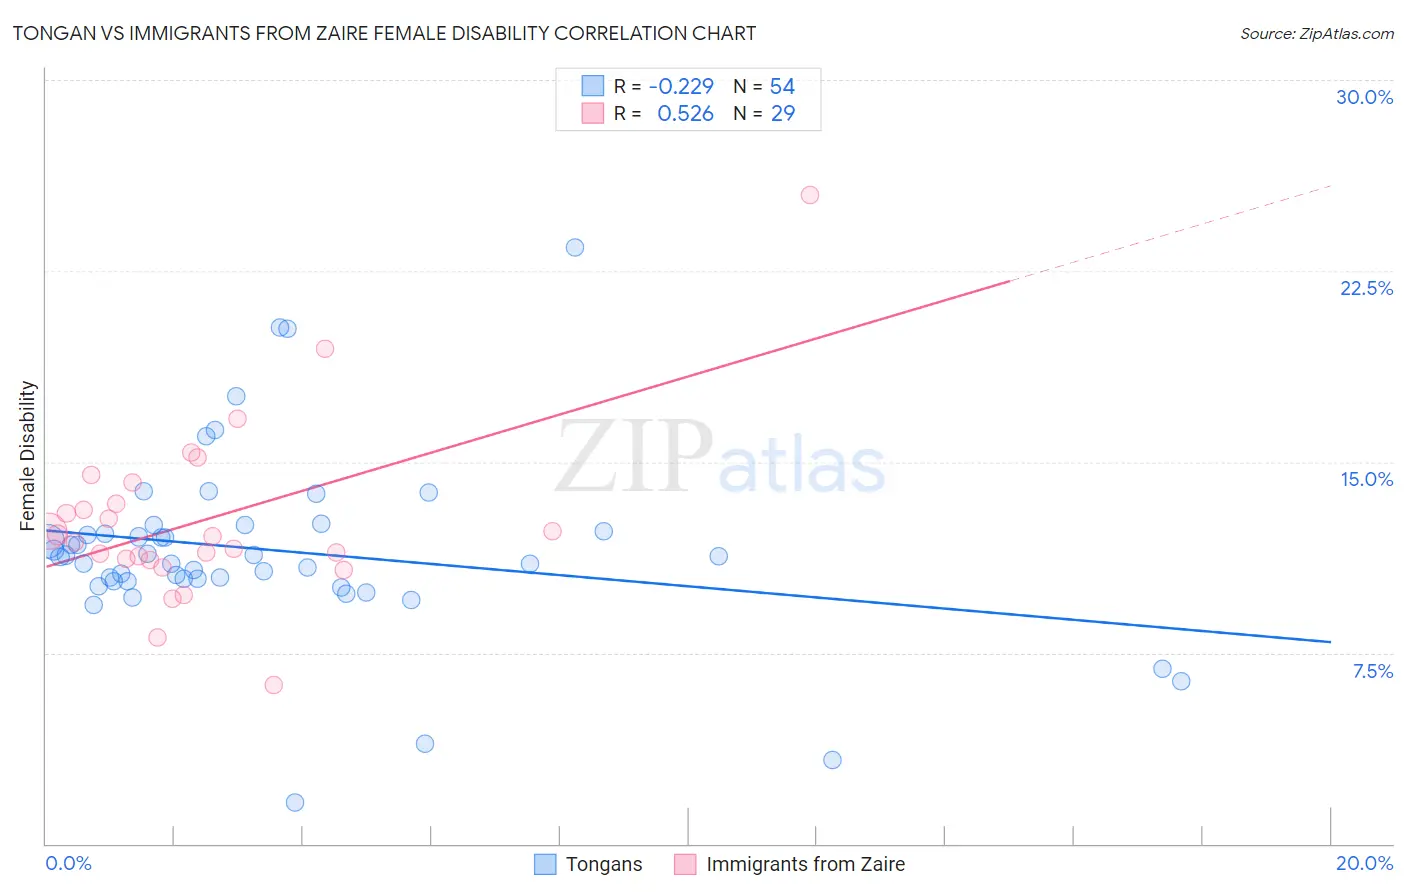
Tongan vs Immigrants from Zaire Female Disability Correlation Chart
The statistical analysis conducted on geographies consisting of 102,892,967 people shows a weak negative correlation between the proportion of Tongans and percentage of females with a disability in the United States with a correlation coefficient (R) of -0.229 and weighted average of 11.3%. Similarly, the statistical analysis conducted on geographies consisting of 107,254,316 people shows a substantial positive correlation between the proportion of Immigrants from Zaire and percentage of females with a disability in the United States with a correlation coefficient (R) of 0.526 and weighted average of 12.3%, a difference of 9.5%.
Female Disability Correlation Summary
| Measurement | Tongan | Immigrants from Zaire |
| Minimum | 1.6% | 6.2% |
| Maximum | 23.4% | 25.5% |
| Range | 21.8% | 19.3% |
| Mean | 11.5% | 12.7% |
| Median | 11.3% | 12.1% |
| Interquartile 25% (IQ1) | 10.3% | 11.2% |
| Interquartile 75% (IQ3) | 12.3% | 13.8% |
| Interquartile Range (IQR) | 1.9% | 2.6% |
| Standard Deviation (Sample) | 3.6% | 3.5% |
| Standard Deviation (Population) | 3.6% | 3.5% |
Similar Demographics by Female Disability
Demographics Similar to Tongans by Female Disability
In terms of female disability, the demographic groups most similar to Tongans are Jordanian (11.3%, a difference of 0.010%), Zimbabwean (11.3%, a difference of 0.010%), Immigrants from Nepal (11.3%, a difference of 0.030%), Immigrants from Sweden (11.3%, a difference of 0.080%), and Cambodian (11.3%, a difference of 0.12%).
| Demographics | Rating | Rank | Female Disability |
| Israelis | 100.0 /100 | #42 | Exceptional 11.2% |
| Afghans | 100.0 /100 | #43 | Exceptional 11.2% |
| Cambodians | 100.0 /100 | #44 | Exceptional 11.3% |
| Immigrants | Sweden | 100.0 /100 | #45 | Exceptional 11.3% |
| Immigrants | Nepal | 100.0 /100 | #46 | Exceptional 11.3% |
| Jordanians | 100.0 /100 | #47 | Exceptional 11.3% |
| Zimbabweans | 100.0 /100 | #48 | Exceptional 11.3% |
| Tongans | 100.0 /100 | #49 | Exceptional 11.3% |
| Inupiat | 100.0 /100 | #50 | Exceptional 11.3% |
| Immigrants | Belgium | 100.0 /100 | #51 | Exceptional 11.3% |
| Immigrants | Peru | 99.9 /100 | #52 | Exceptional 11.3% |
| Immigrants | Saudi Arabia | 99.9 /100 | #53 | Exceptional 11.3% |
| Peruvians | 99.9 /100 | #54 | Exceptional 11.3% |
| Bulgarians | 99.9 /100 | #55 | Exceptional 11.3% |
| Taiwanese | 99.9 /100 | #56 | Exceptional 11.4% |
Demographics Similar to Immigrants from Zaire by Female Disability
In terms of female disability, the demographic groups most similar to Immigrants from Zaire are Immigrants from Barbados (12.3%, a difference of 0.020%), Immigrants from Grenada (12.4%, a difference of 0.020%), Somali (12.3%, a difference of 0.040%), Immigrants from Cuba (12.4%, a difference of 0.040%), and Croatian (12.4%, a difference of 0.040%).
| Demographics | Rating | Rank | Female Disability |
| Hondurans | 25.4 /100 | #197 | Fair 12.3% |
| Mexican American Indians | 24.9 /100 | #198 | Fair 12.3% |
| Immigrants | Trinidad and Tobago | 24.7 /100 | #199 | Fair 12.3% |
| Trinidadians and Tobagonians | 22.4 /100 | #200 | Fair 12.3% |
| Chinese | 22.1 /100 | #201 | Fair 12.3% |
| Somalis | 21.5 /100 | #202 | Fair 12.3% |
| Immigrants | Barbados | 21.1 /100 | #203 | Fair 12.3% |
| Immigrants | Zaire | 20.9 /100 | #204 | Fair 12.3% |
| Immigrants | Grenada | 20.5 /100 | #205 | Fair 12.4% |
| Immigrants | Cuba | 20.2 /100 | #206 | Fair 12.4% |
| Croatians | 20.2 /100 | #207 | Fair 12.4% |
| Basques | 17.5 /100 | #208 | Poor 12.4% |
| Mexicans | 15.7 /100 | #209 | Poor 12.4% |
| Swiss | 14.9 /100 | #210 | Poor 12.4% |
| Immigrants | Bosnia and Herzegovina | 14.8 /100 | #211 | Poor 12.4% |