Immigrants from Guyana vs Immigrants from Cabo Verde Female Disability
COMPARE
Immigrants from Guyana
Immigrants from Cabo Verde
Female Disability
Female Disability Comparison
Immigrants from Guyana
Immigrants from Cabo Verde
12.2%
FEMALE DISABILITY
43.1/ 100
METRIC RATING
176th/ 347
METRIC RANK
14.6%
FEMALE DISABILITY
0.0/ 100
METRIC RATING
331st/ 347
METRIC RANK
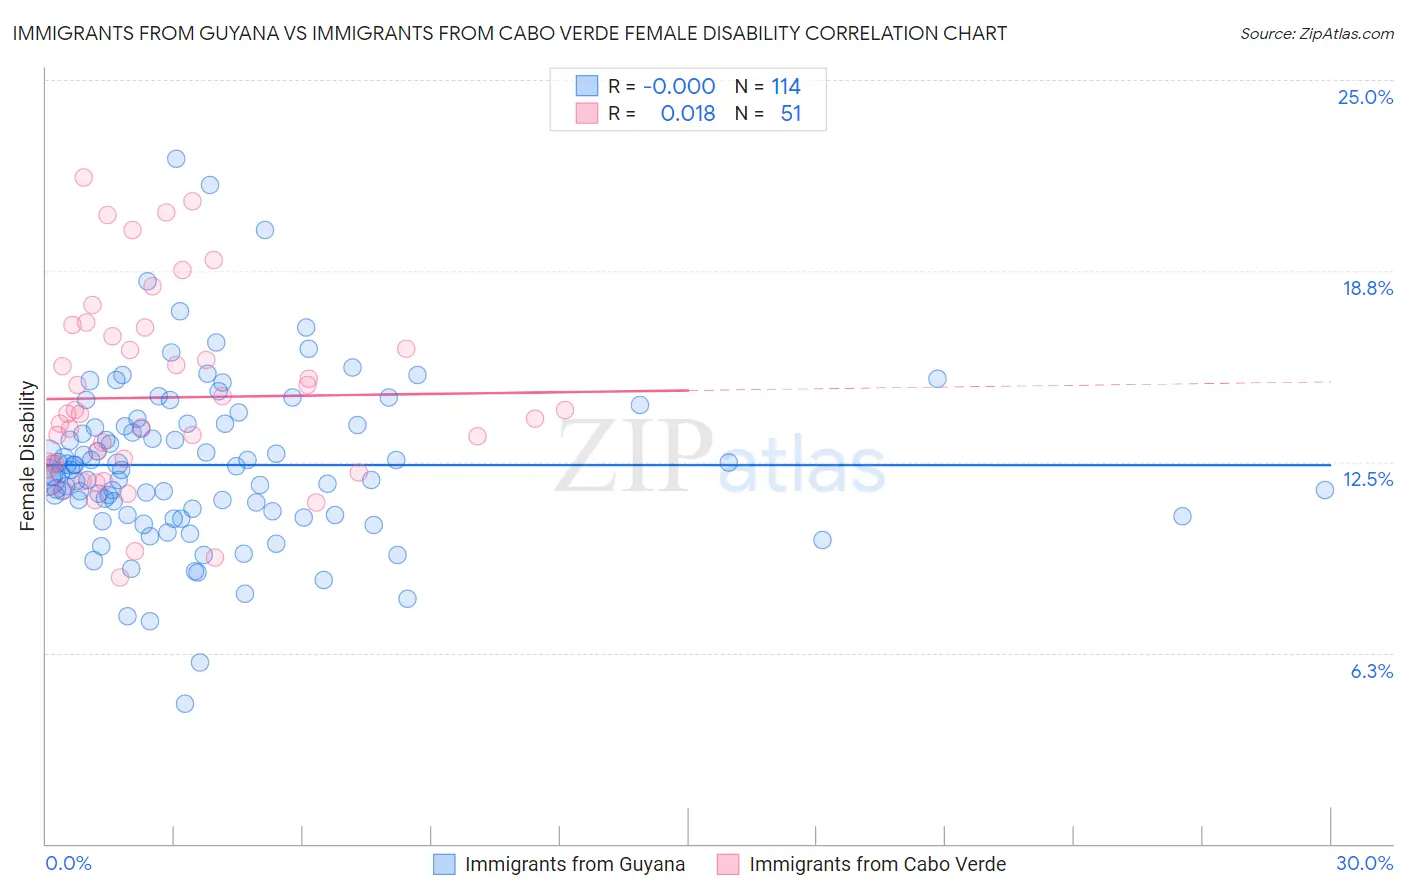
Immigrants from Guyana vs Immigrants from Cabo Verde Female Disability Correlation Chart
The statistical analysis conducted on geographies consisting of 183,713,039 people shows no correlation between the proportion of Immigrants from Guyana and percentage of females with a disability in the United States with a correlation coefficient (R) of -0.000 and weighted average of 12.2%. Similarly, the statistical analysis conducted on geographies consisting of 38,139,523 people shows no correlation between the proportion of Immigrants from Cabo Verde and percentage of females with a disability in the United States with a correlation coefficient (R) of 0.018 and weighted average of 14.6%, a difference of 19.1%.
Female Disability Correlation Summary
| Measurement | Immigrants from Guyana | Immigrants from Cabo Verde |
| Minimum | 4.6% | 8.7% |
| Maximum | 22.4% | 21.8% |
| Range | 17.8% | 13.1% |
| Mean | 12.4% | 14.6% |
| Median | 12.2% | 14.1% |
| Interquartile 25% (IQ1) | 10.8% | 12.4% |
| Interquartile 75% (IQ3) | 13.7% | 16.6% |
| Interquartile Range (IQR) | 2.9% | 4.2% |
| Standard Deviation (Sample) | 2.7% | 3.1% |
| Standard Deviation (Population) | 2.7% | 3.1% |
Similar Demographics by Female Disability
Demographics Similar to Immigrants from Guyana by Female Disability
In terms of female disability, the demographic groups most similar to Immigrants from Guyana are Immigrants from Ghana (12.2%, a difference of 0.030%), Immigrants from Western Europe (12.2%, a difference of 0.080%), Immigrants from Fiji (12.3%, a difference of 0.19%), Albanian (12.3%, a difference of 0.20%), and Immigrants from Canada (12.3%, a difference of 0.23%).
| Demographics | Rating | Rank | Female Disability |
| Lebanese | 58.1 /100 | #169 | Average 12.2% |
| Maltese | 57.0 /100 | #170 | Average 12.2% |
| Immigrants | Southern Europe | 56.3 /100 | #171 | Average 12.2% |
| Haitians | 51.9 /100 | #172 | Average 12.2% |
| Immigrants | Mexico | 50.8 /100 | #173 | Average 12.2% |
| Immigrants | England | 50.0 /100 | #174 | Average 12.2% |
| Immigrants | St. Vincent and the Grenadines | 49.7 /100 | #175 | Average 12.2% |
| Immigrants | Guyana | 43.1 /100 | #176 | Average 12.2% |
| Immigrants | Ghana | 42.5 /100 | #177 | Average 12.2% |
| Immigrants | Western Europe | 40.9 /100 | #178 | Average 12.2% |
| Immigrants | Fiji | 38.2 /100 | #179 | Fair 12.3% |
| Albanians | 37.9 /100 | #180 | Fair 12.3% |
| Immigrants | Canada | 37.2 /100 | #181 | Fair 12.3% |
| Norwegians | 36.9 /100 | #182 | Fair 12.3% |
| Cubans | 36.5 /100 | #183 | Fair 12.3% |
Demographics Similar to Immigrants from Cabo Verde by Female Disability
In terms of female disability, the demographic groups most similar to Immigrants from Cabo Verde are Yuman (14.5%, a difference of 0.42%), Pima (14.8%, a difference of 1.6%), Osage (14.3%, a difference of 1.8%), Immigrants from the Azores (14.9%, a difference of 2.0%), and Cherokee (14.9%, a difference of 2.1%).
| Demographics | Rating | Rank | Female Disability |
| Natives/Alaskans | 0.0 /100 | #324 | Tragic 14.1% |
| Navajo | 0.0 /100 | #325 | Tragic 14.2% |
| Comanche | 0.0 /100 | #326 | Tragic 14.2% |
| Ottawa | 0.0 /100 | #327 | Tragic 14.2% |
| Cape Verdeans | 0.0 /100 | #328 | Tragic 14.2% |
| Osage | 0.0 /100 | #329 | Tragic 14.3% |
| Yuman | 0.0 /100 | #330 | Tragic 14.5% |
| Immigrants | Cabo Verde | 0.0 /100 | #331 | Tragic 14.6% |
| Pima | 0.0 /100 | #332 | Tragic 14.8% |
| Immigrants | Azores | 0.0 /100 | #333 | Tragic 14.9% |
| Cherokee | 0.0 /100 | #334 | Tragic 14.9% |
| Cajuns | 0.0 /100 | #335 | Tragic 14.9% |
| Seminole | 0.0 /100 | #336 | Tragic 15.0% |
| Tohono O'odham | 0.0 /100 | #337 | Tragic 15.0% |
| Dutch West Indians | 0.0 /100 | #338 | Tragic 15.0% |