Hawaiian vs Immigrants from Cabo Verde Female Disability
COMPARE
Hawaiian
Immigrants from Cabo Verde
Female Disability
Female Disability Comparison
Hawaiians
Immigrants from Cabo Verde
12.7%
FEMALE DISABILITY
1.4/ 100
METRIC RATING
254th/ 347
METRIC RANK
14.6%
FEMALE DISABILITY
0.0/ 100
METRIC RATING
331st/ 347
METRIC RANK
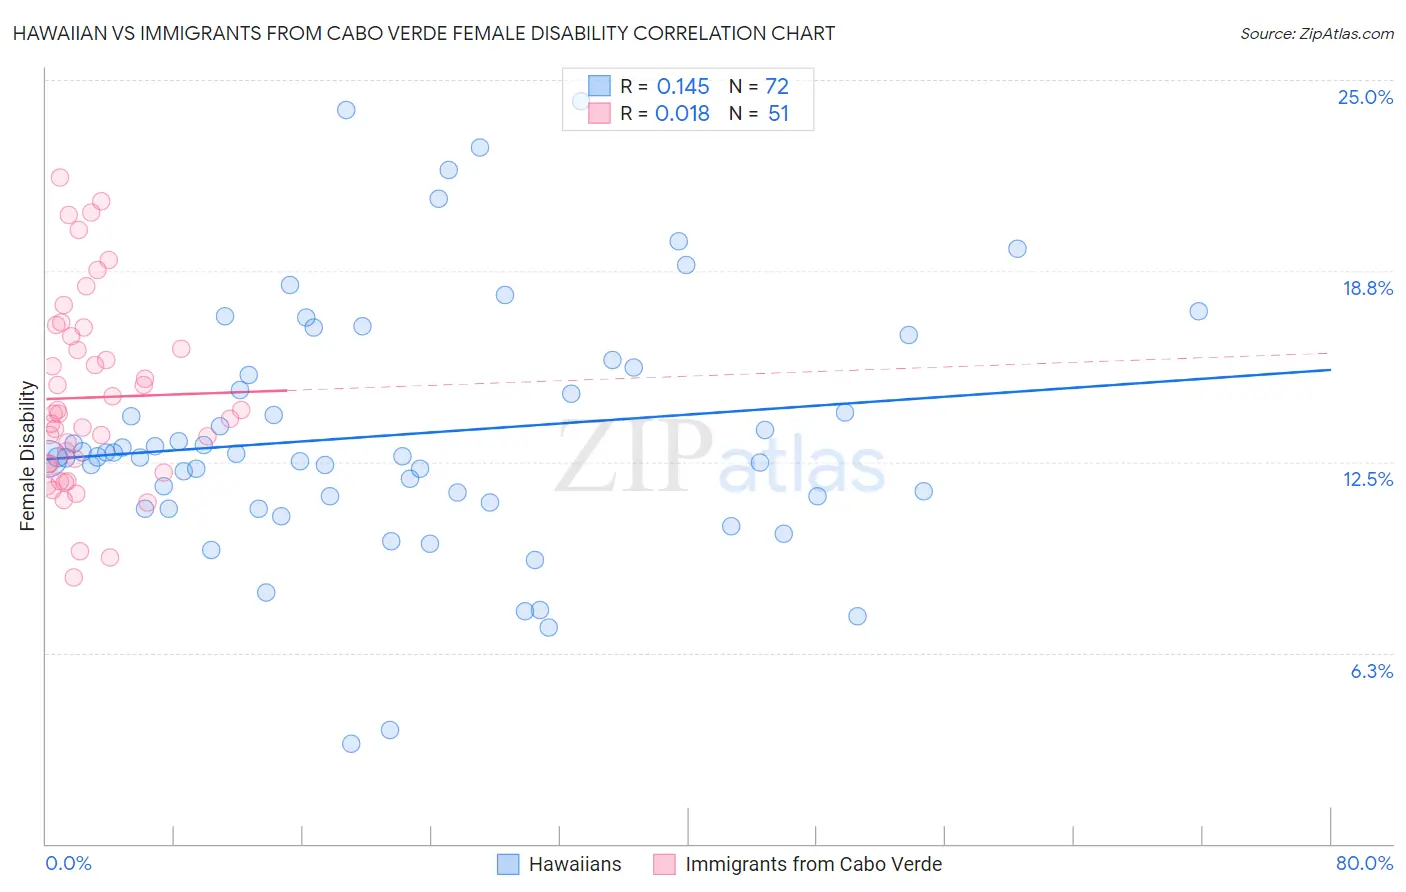
Hawaiian vs Immigrants from Cabo Verde Female Disability Correlation Chart
The statistical analysis conducted on geographies consisting of 327,480,697 people shows a poor positive correlation between the proportion of Hawaiians and percentage of females with a disability in the United States with a correlation coefficient (R) of 0.145 and weighted average of 12.7%. Similarly, the statistical analysis conducted on geographies consisting of 38,139,523 people shows no correlation between the proportion of Immigrants from Cabo Verde and percentage of females with a disability in the United States with a correlation coefficient (R) of 0.018 and weighted average of 14.6%, a difference of 14.8%.
Female Disability Correlation Summary
| Measurement | Hawaiian | Immigrants from Cabo Verde |
| Minimum | 3.3% | 8.7% |
| Maximum | 24.3% | 21.8% |
| Range | 21.1% | 13.1% |
| Mean | 13.4% | 14.6% |
| Median | 12.7% | 14.1% |
| Interquartile 25% (IQ1) | 11.3% | 12.4% |
| Interquartile 75% (IQ3) | 15.5% | 16.6% |
| Interquartile Range (IQR) | 4.2% | 4.2% |
| Standard Deviation (Sample) | 4.1% | 3.1% |
| Standard Deviation (Population) | 4.1% | 3.1% |
Similar Demographics by Female Disability
Demographics Similar to Hawaiians by Female Disability
In terms of female disability, the demographic groups most similar to Hawaiians are Jamaican (12.7%, a difference of 0.030%), Immigrants from Caribbean (12.7%, a difference of 0.040%), Immigrants from Germany (12.7%, a difference of 0.080%), Crow (12.7%, a difference of 0.12%), and British West Indian (12.7%, a difference of 0.15%).
| Demographics | Rating | Rank | Female Disability |
| Menominee | 2.1 /100 | #247 | Tragic 12.6% |
| Carpatho Rusyns | 2.0 /100 | #248 | Tragic 12.6% |
| Immigrants | Congo | 1.8 /100 | #249 | Tragic 12.7% |
| Slovenes | 1.7 /100 | #250 | Tragic 12.7% |
| Crow | 1.6 /100 | #251 | Tragic 12.7% |
| Immigrants | Caribbean | 1.4 /100 | #252 | Tragic 12.7% |
| Jamaicans | 1.4 /100 | #253 | Tragic 12.7% |
| Hawaiians | 1.4 /100 | #254 | Tragic 12.7% |
| Immigrants | Germany | 1.3 /100 | #255 | Tragic 12.7% |
| British West Indians | 1.2 /100 | #256 | Tragic 12.7% |
| Liberians | 1.1 /100 | #257 | Tragic 12.7% |
| Aleuts | 1.1 /100 | #258 | Tragic 12.7% |
| Immigrants | Armenia | 1.0 /100 | #259 | Tragic 12.7% |
| Sub-Saharan Africans | 1.0 /100 | #260 | Tragic 12.7% |
| Bermudans | 1.0 /100 | #261 | Tragic 12.7% |
Demographics Similar to Immigrants from Cabo Verde by Female Disability
In terms of female disability, the demographic groups most similar to Immigrants from Cabo Verde are Yuman (14.5%, a difference of 0.42%), Pima (14.8%, a difference of 1.6%), Osage (14.3%, a difference of 1.8%), Immigrants from the Azores (14.9%, a difference of 2.0%), and Cherokee (14.9%, a difference of 2.1%).
| Demographics | Rating | Rank | Female Disability |
| Natives/Alaskans | 0.0 /100 | #324 | Tragic 14.1% |
| Navajo | 0.0 /100 | #325 | Tragic 14.2% |
| Comanche | 0.0 /100 | #326 | Tragic 14.2% |
| Ottawa | 0.0 /100 | #327 | Tragic 14.2% |
| Cape Verdeans | 0.0 /100 | #328 | Tragic 14.2% |
| Osage | 0.0 /100 | #329 | Tragic 14.3% |
| Yuman | 0.0 /100 | #330 | Tragic 14.5% |
| Immigrants | Cabo Verde | 0.0 /100 | #331 | Tragic 14.6% |
| Pima | 0.0 /100 | #332 | Tragic 14.8% |
| Immigrants | Azores | 0.0 /100 | #333 | Tragic 14.9% |
| Cherokee | 0.0 /100 | #334 | Tragic 14.9% |
| Cajuns | 0.0 /100 | #335 | Tragic 14.9% |
| Seminole | 0.0 /100 | #336 | Tragic 15.0% |
| Tohono O'odham | 0.0 /100 | #337 | Tragic 15.0% |
| Dutch West Indians | 0.0 /100 | #338 | Tragic 15.0% |