Cuban vs Arab Male Disability
COMPARE
Cuban
Arab
Male Disability
Male Disability Comparison
Cubans
Arabs
11.0%
MALE DISABILITY
74.9/ 100
METRIC RATING
151st/ 347
METRIC RANK
11.0%
MALE DISABILITY
81.5/ 100
METRIC RATING
141st/ 347
METRIC RANK
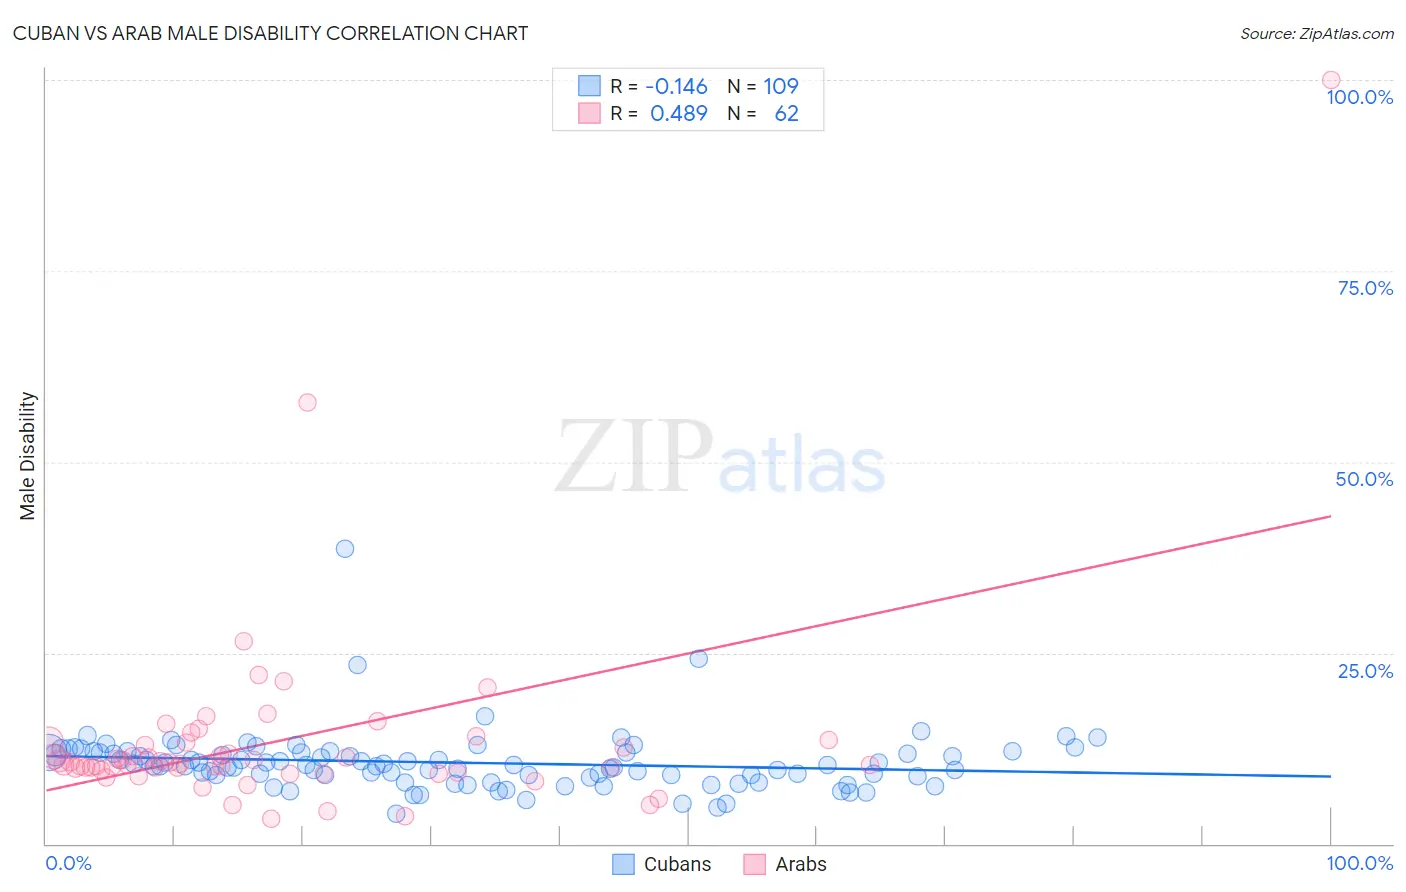
Cuban vs Arab Male Disability Correlation Chart
The statistical analysis conducted on geographies consisting of 449,227,297 people shows a poor negative correlation between the proportion of Cubans and percentage of males with a disability in the United States with a correlation coefficient (R) of -0.146 and weighted average of 11.0%. Similarly, the statistical analysis conducted on geographies consisting of 486,768,170 people shows a moderate positive correlation between the proportion of Arabs and percentage of males with a disability in the United States with a correlation coefficient (R) of 0.489 and weighted average of 11.0%, a difference of 0.55%.
Male Disability Correlation Summary
| Measurement | Cuban | Arab |
| Minimum | 3.9% | 3.3% |
| Maximum | 38.6% | 100.0% |
| Range | 34.7% | 96.7% |
| Mean | 10.6% | 13.5% |
| Median | 10.2% | 10.5% |
| Interquartile 25% (IQ1) | 8.9% | 9.6% |
| Interquartile 75% (IQ3) | 11.9% | 13.2% |
| Interquartile Range (IQR) | 3.0% | 3.6% |
| Standard Deviation (Sample) | 4.0% | 13.3% |
| Standard Deviation (Population) | 4.0% | 13.2% |
Demographics Similar to Cubans and Arabs by Male Disability
In terms of male disability, the demographic groups most similar to Cubans are Immigrants from Guatemala (11.0%, a difference of 0.020%), Immigrants from Albania (11.0%, a difference of 0.030%), Immigrants from Denmark (11.0%, a difference of 0.12%), Immigrants from Northern Europe (11.1%, a difference of 0.12%), and Immigrants from Moldova (11.1%, a difference of 0.15%). Similarly, the demographic groups most similar to Arabs are Immigrants from Italy (11.0%, a difference of 0.0%), Immigrants from Sudan (11.0%, a difference of 0.0%), South African (11.0%, a difference of 0.020%), Nigerian (11.0%, a difference of 0.040%), and Immigrants from Europe (11.0%, a difference of 0.050%).
| Demographics | Rating | Rank | Male Disability |
| Immigrants | Costa Rica | 82.8 /100 | #136 | Excellent 11.0% |
| Immigrants | Europe | 82.0 /100 | #137 | Excellent 11.0% |
| Nigerians | 81.9 /100 | #138 | Excellent 11.0% |
| South Africans | 81.7 /100 | #139 | Excellent 11.0% |
| Immigrants | Italy | 81.5 /100 | #140 | Excellent 11.0% |
| Arabs | 81.5 /100 | #141 | Excellent 11.0% |
| Immigrants | Sudan | 81.5 /100 | #142 | Excellent 11.0% |
| Moroccans | 80.7 /100 | #143 | Excellent 11.0% |
| Kenyans | 78.1 /100 | #144 | Good 11.0% |
| Costa Ricans | 78.0 /100 | #145 | Good 11.0% |
| Koreans | 77.5 /100 | #146 | Good 11.0% |
| Immigrants | Croatia | 77.3 /100 | #147 | Good 11.0% |
| Sudanese | 77.1 /100 | #148 | Good 11.0% |
| Immigrants | Denmark | 76.4 /100 | #149 | Good 11.0% |
| Immigrants | Guatemala | 75.1 /100 | #150 | Good 11.0% |
| Cubans | 74.9 /100 | #151 | Good 11.0% |
| Immigrants | Albania | 74.4 /100 | #152 | Good 11.0% |
| Immigrants | Northern Europe | 73.2 /100 | #153 | Good 11.1% |
| Immigrants | Moldova | 72.8 /100 | #154 | Good 11.1% |
| Immigrants | Middle Africa | 70.9 /100 | #155 | Good 11.1% |
| Russians | 69.8 /100 | #156 | Good 11.1% |