Tohono O'odham vs Central American Indian Male Disability
COMPARE
Tohono O'odham
Central American Indian
Male Disability
Male Disability Comparison
Tohono O'odham
Central American Indians
14.6%
MALE DISABILITY
0.0/ 100
METRIC RATING
331st/ 347
METRIC RANK
12.7%
MALE DISABILITY
0.0/ 100
METRIC RATING
278th/ 347
METRIC RANK
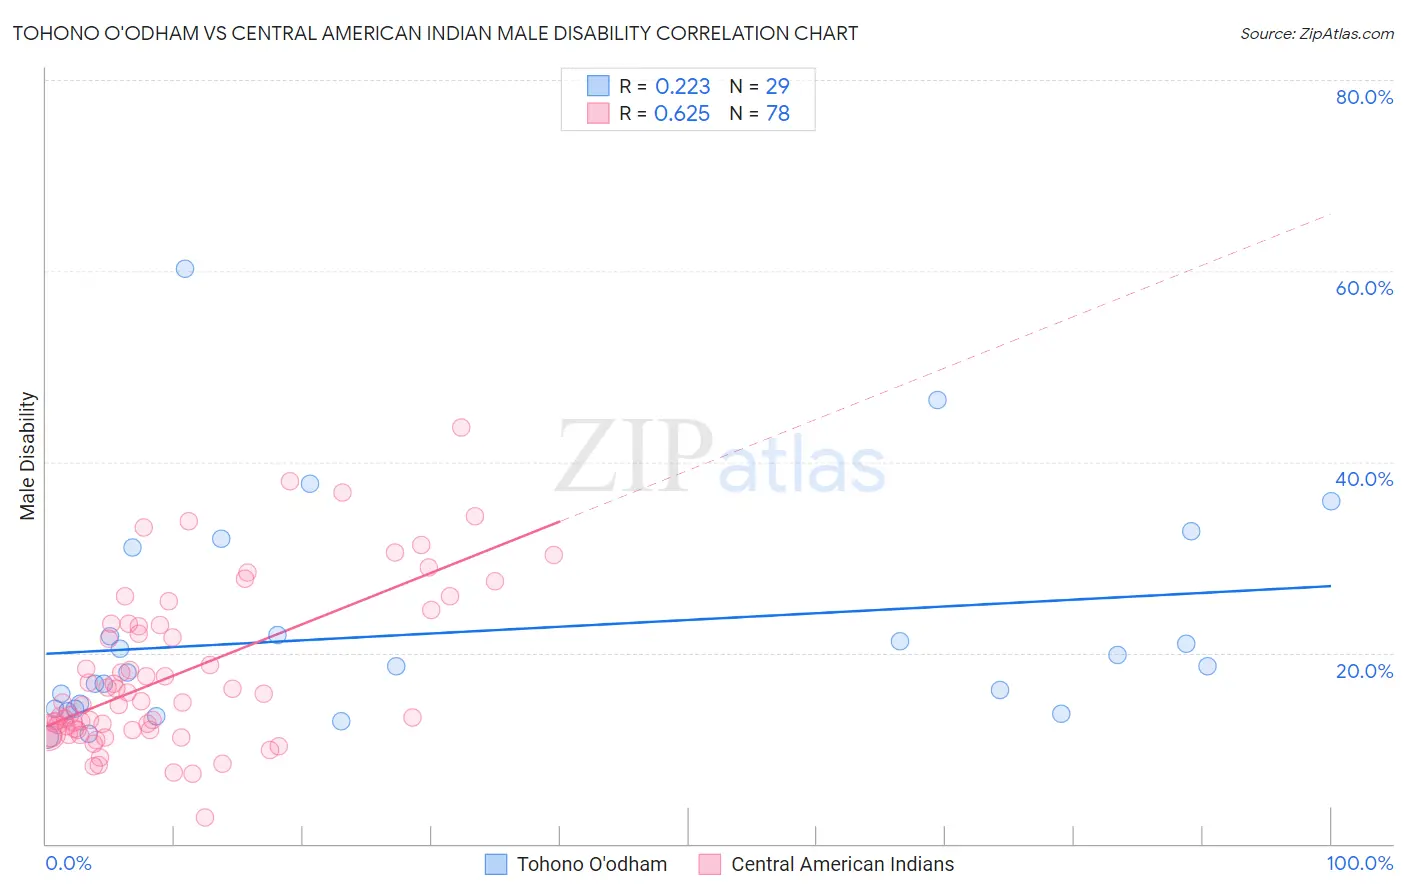
Tohono O'odham vs Central American Indian Male Disability Correlation Chart
The statistical analysis conducted on geographies consisting of 58,720,807 people shows a weak positive correlation between the proportion of Tohono O'odham and percentage of males with a disability in the United States with a correlation coefficient (R) of 0.223 and weighted average of 14.6%. Similarly, the statistical analysis conducted on geographies consisting of 326,112,546 people shows a significant positive correlation between the proportion of Central American Indians and percentage of males with a disability in the United States with a correlation coefficient (R) of 0.625 and weighted average of 12.7%, a difference of 15.3%.
Male Disability Correlation Summary
| Measurement | Tohono O'odham | Central American Indian |
| Minimum | 11.2% | 2.7% |
| Maximum | 60.2% | 43.7% |
| Range | 49.0% | 40.9% |
| Mean | 22.1% | 17.7% |
| Median | 18.6% | 14.8% |
| Interquartile 25% (IQ1) | 14.1% | 11.9% |
| Interquartile 75% (IQ3) | 26.4% | 23.0% |
| Interquartile Range (IQR) | 12.3% | 11.0% |
| Standard Deviation (Sample) | 11.4% | 8.4% |
| Standard Deviation (Population) | 11.2% | 8.3% |
Similar Demographics by Male Disability
Demographics Similar to Tohono O'odham by Male Disability
In terms of male disability, the demographic groups most similar to Tohono O'odham are Seminole (14.7%, a difference of 0.78%), Yuman (14.7%, a difference of 0.87%), Navajo (14.4%, a difference of 1.5%), Cherokee (14.8%, a difference of 1.6%), and Dutch West Indian (14.8%, a difference of 1.6%).
| Demographics | Rating | Rank | Male Disability |
| Comanche | 0.0 /100 | #324 | Tragic 14.1% |
| Ottawa | 0.0 /100 | #325 | Tragic 14.1% |
| Natives/Alaskans | 0.0 /100 | #326 | Tragic 14.2% |
| Potawatomi | 0.0 /100 | #327 | Tragic 14.2% |
| Chippewa | 0.0 /100 | #328 | Tragic 14.3% |
| Cajuns | 0.0 /100 | #329 | Tragic 14.4% |
| Navajo | 0.0 /100 | #330 | Tragic 14.4% |
| Tohono O'odham | 0.0 /100 | #331 | Tragic 14.6% |
| Seminole | 0.0 /100 | #332 | Tragic 14.7% |
| Yuman | 0.0 /100 | #333 | Tragic 14.7% |
| Cherokee | 0.0 /100 | #334 | Tragic 14.8% |
| Dutch West Indians | 0.0 /100 | #335 | Tragic 14.8% |
| Alaskan Athabascans | 0.0 /100 | #336 | Tragic 14.9% |
| Menominee | 0.0 /100 | #337 | Tragic 15.0% |
| Pueblo | 0.0 /100 | #338 | Tragic 15.0% |
Demographics Similar to Central American Indians by Male Disability
In terms of male disability, the demographic groups most similar to Central American Indians are Slovak (12.7%, a difference of 0.15%), Dutch (12.7%, a difference of 0.20%), Sioux (12.7%, a difference of 0.26%), Irish (12.7%, a difference of 0.31%), and German (12.7%, a difference of 0.32%).
| Demographics | Rating | Rank | Male Disability |
| Scandinavians | 0.1 /100 | #271 | Tragic 12.3% |
| Hmong | 0.0 /100 | #272 | Tragic 12.5% |
| Native Hawaiians | 0.0 /100 | #273 | Tragic 12.5% |
| Hopi | 0.0 /100 | #274 | Tragic 12.5% |
| Fijians | 0.0 /100 | #275 | Tragic 12.6% |
| Africans | 0.0 /100 | #276 | Tragic 12.6% |
| Finns | 0.0 /100 | #277 | Tragic 12.6% |
| Central American Indians | 0.0 /100 | #278 | Tragic 12.7% |
| Slovaks | 0.0 /100 | #279 | Tragic 12.7% |
| Dutch | 0.0 /100 | #280 | Tragic 12.7% |
| Sioux | 0.0 /100 | #281 | Tragic 12.7% |
| Irish | 0.0 /100 | #282 | Tragic 12.7% |
| Germans | 0.0 /100 | #283 | Tragic 12.7% |
| Spanish | 0.0 /100 | #284 | Tragic 12.7% |
| Welsh | 0.0 /100 | #285 | Tragic 12.7% |