Vietnamese vs Nepalese Disability Age 18 to 34
COMPARE
Vietnamese
Nepalese
Disability Age 18 to 34
Disability Age 18 to 34 Comparison
Vietnamese
Nepalese
5.5%
DISABILITY AGE 18 TO 34
100.0/ 100
METRIC RATING
11th/ 347
METRIC RANK
7.1%
DISABILITY AGE 18 TO 34
1.1/ 100
METRIC RATING
241st/ 347
METRIC RANK
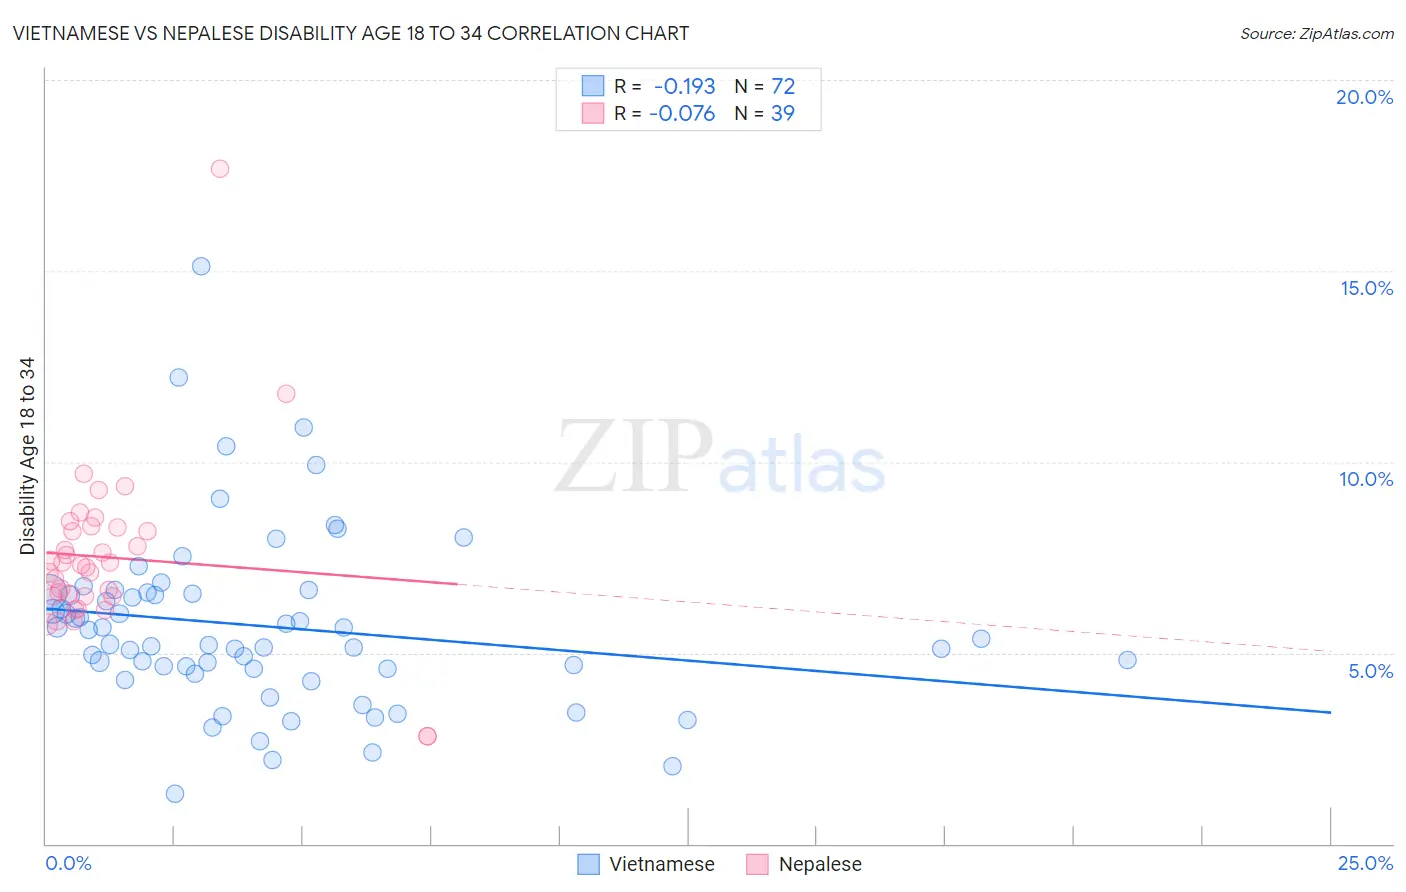
Vietnamese vs Nepalese Disability Age 18 to 34 Correlation Chart
The statistical analysis conducted on geographies consisting of 170,704,873 people shows a poor negative correlation between the proportion of Vietnamese and percentage of population with a disability between the ages 18 and 35 in the United States with a correlation coefficient (R) of -0.193 and weighted average of 5.5%. Similarly, the statistical analysis conducted on geographies consisting of 24,520,458 people shows a slight negative correlation between the proportion of Nepalese and percentage of population with a disability between the ages 18 and 35 in the United States with a correlation coefficient (R) of -0.076 and weighted average of 7.1%, a difference of 28.9%.
Disability Age 18 to 34 Correlation Summary
| Measurement | Vietnamese | Nepalese |
| Minimum | 1.3% | 2.8% |
| Maximum | 15.1% | 17.7% |
| Range | 13.8% | 14.9% |
| Mean | 5.7% | 7.5% |
| Median | 5.3% | 7.3% |
| Interquartile 25% (IQ1) | 4.6% | 6.5% |
| Interquartile 75% (IQ3) | 6.6% | 8.3% |
| Interquartile Range (IQR) | 2.0% | 1.8% |
| Standard Deviation (Sample) | 2.3% | 2.3% |
| Standard Deviation (Population) | 2.3% | 2.3% |
Similar Demographics by Disability Age 18 to 34
Demographics Similar to Vietnamese by Disability Age 18 to 34
In terms of disability age 18 to 34, the demographic groups most similar to Vietnamese are Immigrants from St. Vincent and the Grenadines (5.5%, a difference of 0.060%), Immigrants from Uzbekistan (5.5%, a difference of 0.070%), Guyanese (5.5%, a difference of 0.22%), Immigrants from Iran (5.5%, a difference of 0.38%), and Indian (Asian) (5.5%, a difference of 0.53%).
| Demographics | Rating | Rank | Disability Age 18 to 34 |
| Immigrants | Cuba | 100.0 /100 | #4 | Exceptional 5.4% |
| Immigrants | Taiwan | 100.0 /100 | #5 | Exceptional 5.4% |
| Filipinos | 100.0 /100 | #6 | Exceptional 5.4% |
| Immigrants | China | 100.0 /100 | #7 | Exceptional 5.4% |
| Immigrants | Guyana | 100.0 /100 | #8 | Exceptional 5.5% |
| Guyanese | 100.0 /100 | #9 | Exceptional 5.5% |
| Immigrants | Uzbekistan | 100.0 /100 | #10 | Exceptional 5.5% |
| Vietnamese | 100.0 /100 | #11 | Exceptional 5.5% |
| Immigrants | St. Vincent and the Grenadines | 100.0 /100 | #12 | Exceptional 5.5% |
| Immigrants | Iran | 100.0 /100 | #13 | Exceptional 5.5% |
| Indians (Asian) | 100.0 /100 | #14 | Exceptional 5.5% |
| Immigrants | India | 100.0 /100 | #15 | Exceptional 5.6% |
| Immigrants | Israel | 100.0 /100 | #16 | Exceptional 5.6% |
| Immigrants | Eastern Asia | 100.0 /100 | #17 | Exceptional 5.6% |
| Immigrants | Bolivia | 100.0 /100 | #18 | Exceptional 5.6% |
Demographics Similar to Nepalese by Disability Age 18 to 34
In terms of disability age 18 to 34, the demographic groups most similar to Nepalese are Arapaho (7.1%, a difference of 0.0%), Immigrants from Congo (7.1%, a difference of 0.040%), Icelander (7.1%, a difference of 0.11%), Italian (7.1%, a difference of 0.12%), and Marshallese (7.1%, a difference of 0.24%).
| Demographics | Rating | Rank | Disability Age 18 to 34 |
| Alsatians | 2.1 /100 | #234 | Tragic 7.0% |
| Sub-Saharan Africans | 1.7 /100 | #235 | Tragic 7.1% |
| Liberians | 1.5 /100 | #236 | Tragic 7.1% |
| Austrians | 1.3 /100 | #237 | Tragic 7.1% |
| Marshallese | 1.3 /100 | #238 | Tragic 7.1% |
| Italians | 1.2 /100 | #239 | Tragic 7.1% |
| Arapaho | 1.1 /100 | #240 | Tragic 7.1% |
| Nepalese | 1.1 /100 | #241 | Tragic 7.1% |
| Immigrants | Congo | 1.1 /100 | #242 | Tragic 7.1% |
| Icelanders | 1.0 /100 | #243 | Tragic 7.1% |
| Immigrants | Zaire | 0.9 /100 | #244 | Tragic 7.1% |
| Hungarians | 0.9 /100 | #245 | Tragic 7.1% |
| Immigrants | Liberia | 0.8 /100 | #246 | Tragic 7.1% |
| Yugoslavians | 0.8 /100 | #247 | Tragic 7.2% |
| Guamanians/Chamorros | 0.8 /100 | #248 | Tragic 7.2% |