Senegalese vs Immigrants from Ireland Hearing Disability
COMPARE
Senegalese
Immigrants from Ireland
Hearing Disability
Hearing Disability Comparison
Senegalese
Immigrants from Ireland
2.6%
HEARING DISABILITY
99.4/ 100
METRIC RATING
43rd/ 347
METRIC RANK
3.0%
HEARING DISABILITY
37.4/ 100
METRIC RATING
184th/ 347
METRIC RANK
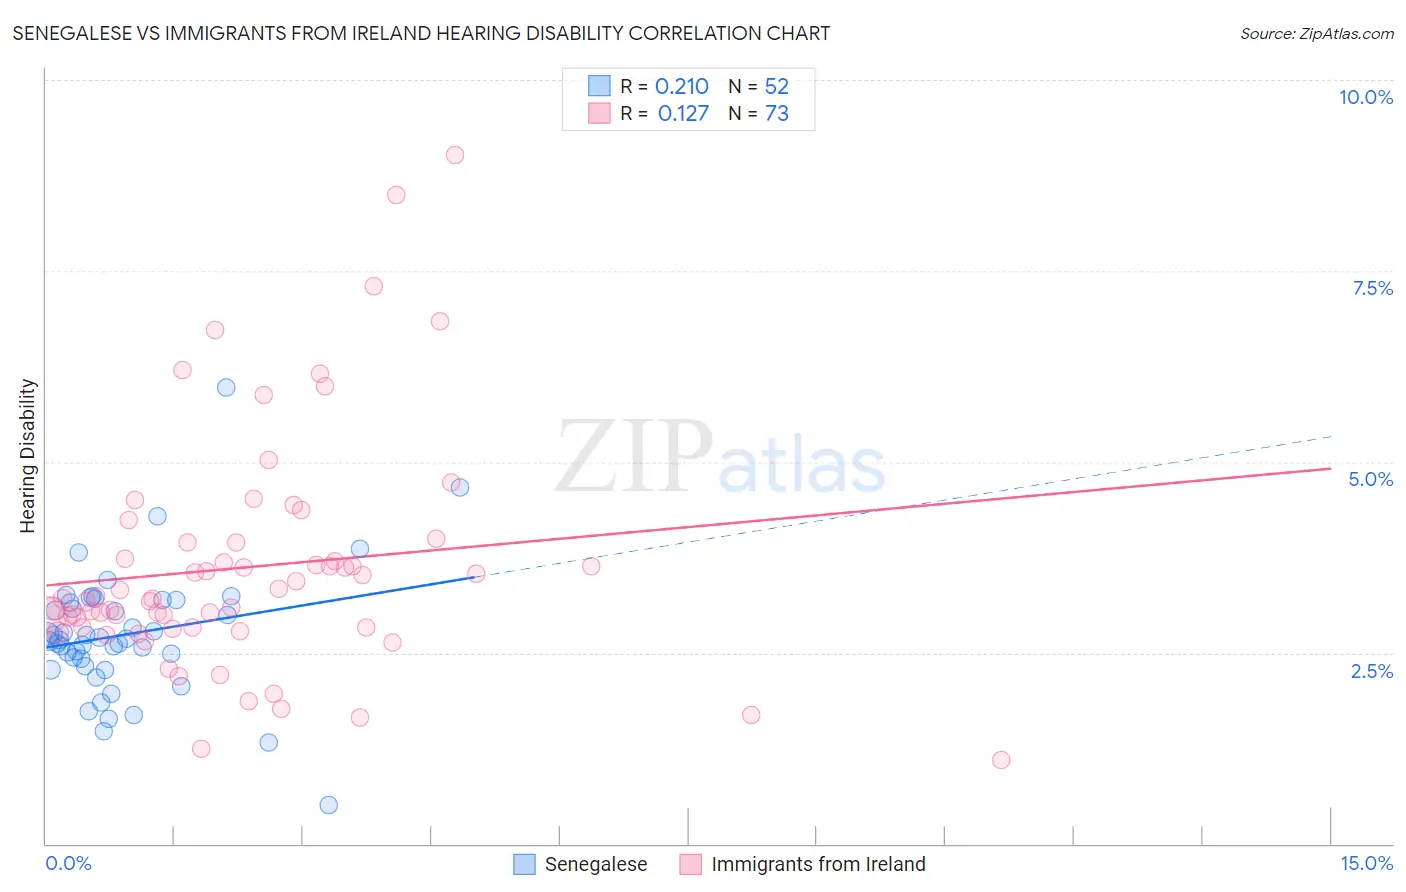
Senegalese vs Immigrants from Ireland Hearing Disability Correlation Chart
The statistical analysis conducted on geographies consisting of 78,133,059 people shows a weak positive correlation between the proportion of Senegalese and percentage of population with hearing disability in the United States with a correlation coefficient (R) of 0.210 and weighted average of 2.6%. Similarly, the statistical analysis conducted on geographies consisting of 240,758,796 people shows a poor positive correlation between the proportion of Immigrants from Ireland and percentage of population with hearing disability in the United States with a correlation coefficient (R) of 0.127 and weighted average of 3.0%, a difference of 15.0%.
Hearing Disability Correlation Summary
| Measurement | Senegalese | Immigrants from Ireland |
| Minimum | 0.50% | 1.1% |
| Maximum | 6.0% | 9.0% |
| Range | 5.5% | 7.9% |
| Mean | 2.7% | 3.6% |
| Median | 2.7% | 3.2% |
| Interquartile 25% (IQ1) | 2.4% | 2.8% |
| Interquartile 75% (IQ3) | 3.2% | 3.9% |
| Interquartile Range (IQR) | 0.80% | 1.1% |
| Standard Deviation (Sample) | 0.85% | 1.5% |
| Standard Deviation (Population) | 0.84% | 1.5% |
Similar Demographics by Hearing Disability
Demographics Similar to Senegalese by Hearing Disability
In terms of hearing disability, the demographic groups most similar to Senegalese are Immigrants from Taiwan (2.6%, a difference of 0.010%), West Indian (2.6%, a difference of 0.010%), Nigerian (2.6%, a difference of 0.22%), Venezuelan (2.6%, a difference of 0.25%), and Haitian (2.6%, a difference of 0.35%).
| Demographics | Rating | Rank | Hearing Disability |
| Okinawans | 99.6 /100 | #36 | Exceptional 2.6% |
| Immigrants | Western Africa | 99.6 /100 | #37 | Exceptional 2.6% |
| Immigrants | Jamaica | 99.5 /100 | #38 | Exceptional 2.6% |
| Immigrants | China | 99.5 /100 | #39 | Exceptional 2.6% |
| Haitians | 99.5 /100 | #40 | Exceptional 2.6% |
| Immigrants | Taiwan | 99.4 /100 | #41 | Exceptional 2.6% |
| West Indians | 99.4 /100 | #42 | Exceptional 2.6% |
| Senegalese | 99.4 /100 | #43 | Exceptional 2.6% |
| Nigerians | 99.4 /100 | #44 | Exceptional 2.6% |
| Venezuelans | 99.4 /100 | #45 | Exceptional 2.6% |
| Immigrants | Dominica | 99.3 /100 | #46 | Exceptional 2.6% |
| Immigrants | Israel | 99.3 /100 | #47 | Exceptional 2.6% |
| Immigrants | Singapore | 99.3 /100 | #48 | Exceptional 2.6% |
| Immigrants | South America | 99.2 /100 | #49 | Exceptional 2.7% |
| Paraguayans | 99.2 /100 | #50 | Exceptional 2.7% |
Demographics Similar to Immigrants from Ireland by Hearing Disability
In terms of hearing disability, the demographic groups most similar to Immigrants from Ireland are Immigrants from Southern Europe (3.0%, a difference of 0.21%), Bulgarian (3.0%, a difference of 0.23%), Immigrants from Mexico (3.0%, a difference of 0.25%), Black/African American (3.0%, a difference of 0.27%), and Mexican American Indian (3.0%, a difference of 0.27%).
| Demographics | Rating | Rank | Hearing Disability |
| Immigrants | Philippines | 46.4 /100 | #177 | Average 3.0% |
| Japanese | 46.0 /100 | #178 | Average 3.0% |
| Immigrants | Moldova | 43.1 /100 | #179 | Average 3.0% |
| Immigrants | Sweden | 42.4 /100 | #180 | Average 3.0% |
| Immigrants | Belgium | 41.5 /100 | #181 | Average 3.0% |
| Immigrants | Italy | 41.1 /100 | #182 | Average 3.0% |
| Bulgarians | 39.7 /100 | #183 | Fair 3.0% |
| Immigrants | Ireland | 37.4 /100 | #184 | Fair 3.0% |
| Immigrants | Southern Europe | 35.3 /100 | #185 | Fair 3.0% |
| Immigrants | Mexico | 34.9 /100 | #186 | Fair 3.0% |
| Blacks/African Americans | 34.7 /100 | #187 | Fair 3.0% |
| Mexican American Indians | 34.7 /100 | #188 | Fair 3.0% |
| Africans | 32.9 /100 | #189 | Fair 3.0% |
| Immigrants | South Africa | 31.1 /100 | #190 | Fair 3.1% |
| Immigrants | Switzerland | 28.8 /100 | #191 | Fair 3.1% |