American vs Immigrants from Ireland Hearing Disability
COMPARE
American
Immigrants from Ireland
Hearing Disability
Hearing Disability Comparison
Americans
Immigrants from Ireland
3.9%
HEARING DISABILITY
0.0/ 100
METRIC RATING
311th/ 347
METRIC RANK
3.0%
HEARING DISABILITY
37.4/ 100
METRIC RATING
184th/ 347
METRIC RANK
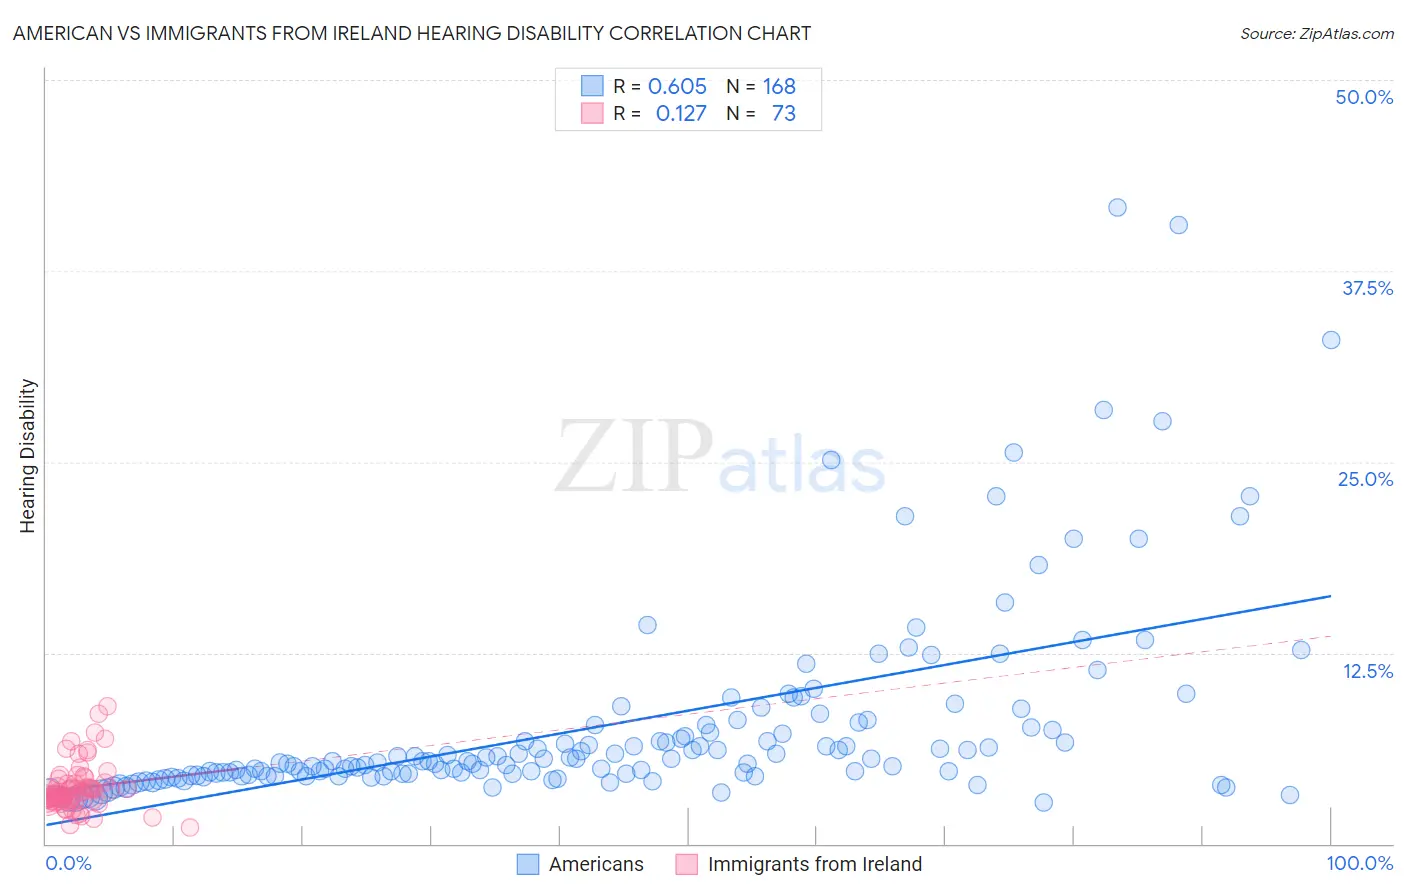
American vs Immigrants from Ireland Hearing Disability Correlation Chart
The statistical analysis conducted on geographies consisting of 581,034,081 people shows a significant positive correlation between the proportion of Americans and percentage of population with hearing disability in the United States with a correlation coefficient (R) of 0.605 and weighted average of 3.9%. Similarly, the statistical analysis conducted on geographies consisting of 240,758,796 people shows a poor positive correlation between the proportion of Immigrants from Ireland and percentage of population with hearing disability in the United States with a correlation coefficient (R) of 0.127 and weighted average of 3.0%, a difference of 28.5%.
Hearing Disability Correlation Summary
| Measurement | American | Immigrants from Ireland |
| Minimum | 2.7% | 1.1% |
| Maximum | 41.7% | 9.0% |
| Range | 38.9% | 7.9% |
| Mean | 7.7% | 3.6% |
| Median | 5.4% | 3.2% |
| Interquartile 25% (IQ1) | 4.5% | 2.8% |
| Interquartile 75% (IQ3) | 7.7% | 3.9% |
| Interquartile Range (IQR) | 3.2% | 1.1% |
| Standard Deviation (Sample) | 6.5% | 1.5% |
| Standard Deviation (Population) | 6.5% | 1.5% |
Similar Demographics by Hearing Disability
Demographics Similar to Americans by Hearing Disability
In terms of hearing disability, the demographic groups most similar to Americans are Cajun (3.9%, a difference of 1.1%), Hopi (3.9%, a difference of 1.2%), Cree (3.8%, a difference of 1.3%), Yakama (3.9%, a difference of 1.4%), and Puget Sound Salish (3.9%, a difference of 1.4%).
| Demographics | Rating | Rank | Hearing Disability |
| French | 0.0 /100 | #304 | Tragic 3.8% |
| English | 0.0 /100 | #305 | Tragic 3.8% |
| Marshallese | 0.0 /100 | #306 | Tragic 3.8% |
| French Canadians | 0.0 /100 | #307 | Tragic 3.8% |
| Ottawa | 0.0 /100 | #308 | Tragic 3.8% |
| Scotch-Irish | 0.0 /100 | #309 | Tragic 3.8% |
| Cree | 0.0 /100 | #310 | Tragic 3.8% |
| Americans | 0.0 /100 | #311 | Tragic 3.9% |
| Cajuns | 0.0 /100 | #312 | Tragic 3.9% |
| Hopi | 0.0 /100 | #313 | Tragic 3.9% |
| Yakama | 0.0 /100 | #314 | Tragic 3.9% |
| Puget Sound Salish | 0.0 /100 | #315 | Tragic 3.9% |
| Spanish Americans | 0.0 /100 | #316 | Tragic 4.0% |
| Comanche | 0.0 /100 | #317 | Tragic 4.0% |
| Cheyenne | 0.0 /100 | #318 | Tragic 4.0% |
Demographics Similar to Immigrants from Ireland by Hearing Disability
In terms of hearing disability, the demographic groups most similar to Immigrants from Ireland are Immigrants from Southern Europe (3.0%, a difference of 0.21%), Bulgarian (3.0%, a difference of 0.23%), Immigrants from Mexico (3.0%, a difference of 0.25%), Black/African American (3.0%, a difference of 0.27%), and Mexican American Indian (3.0%, a difference of 0.27%).
| Demographics | Rating | Rank | Hearing Disability |
| Immigrants | Philippines | 46.4 /100 | #177 | Average 3.0% |
| Japanese | 46.0 /100 | #178 | Average 3.0% |
| Immigrants | Moldova | 43.1 /100 | #179 | Average 3.0% |
| Immigrants | Sweden | 42.4 /100 | #180 | Average 3.0% |
| Immigrants | Belgium | 41.5 /100 | #181 | Average 3.0% |
| Immigrants | Italy | 41.1 /100 | #182 | Average 3.0% |
| Bulgarians | 39.7 /100 | #183 | Fair 3.0% |
| Immigrants | Ireland | 37.4 /100 | #184 | Fair 3.0% |
| Immigrants | Southern Europe | 35.3 /100 | #185 | Fair 3.0% |
| Immigrants | Mexico | 34.9 /100 | #186 | Fair 3.0% |
| Blacks/African Americans | 34.7 /100 | #187 | Fair 3.0% |
| Mexican American Indians | 34.7 /100 | #188 | Fair 3.0% |
| Africans | 32.9 /100 | #189 | Fair 3.0% |
| Immigrants | South Africa | 31.1 /100 | #190 | Fair 3.1% |
| Immigrants | Switzerland | 28.8 /100 | #191 | Fair 3.1% |