Arapaho vs Immigrants from Eritrea Disability
COMPARE
Arapaho
Immigrants from Eritrea
Disability
Disability Comparison
Arapaho
Immigrants from Eritrea
13.2%
DISABILITY
0.0/ 100
METRIC RATING
302nd/ 347
METRIC RANK
11.0%
DISABILITY
99.7/ 100
METRIC RATING
63rd/ 347
METRIC RANK
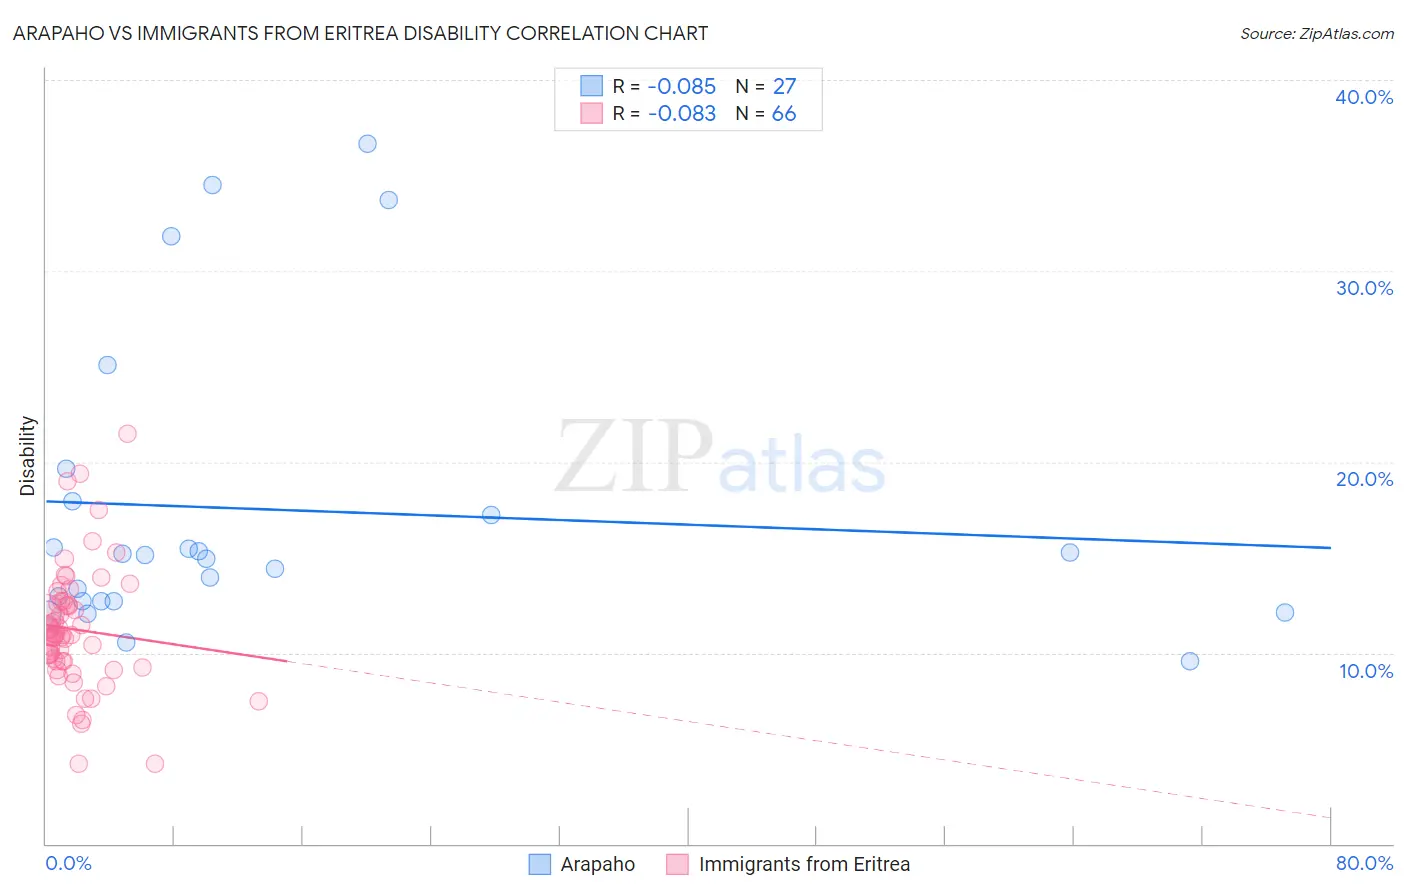
Arapaho vs Immigrants from Eritrea Disability Correlation Chart
The statistical analysis conducted on geographies consisting of 29,780,325 people shows a slight negative correlation between the proportion of Arapaho and percentage of population with a disability in the United States with a correlation coefficient (R) of -0.085 and weighted average of 13.2%. Similarly, the statistical analysis conducted on geographies consisting of 104,852,788 people shows a slight negative correlation between the proportion of Immigrants from Eritrea and percentage of population with a disability in the United States with a correlation coefficient (R) of -0.083 and weighted average of 11.0%, a difference of 20.7%.
Disability Correlation Summary
| Measurement | Arapaho | Immigrants from Eritrea |
| Minimum | 9.5% | 4.2% |
| Maximum | 36.7% | 21.4% |
| Range | 27.1% | 17.2% |
| Mean | 17.5% | 11.2% |
| Median | 15.1% | 10.9% |
| Interquartile 25% (IQ1) | 12.7% | 9.6% |
| Interquartile 75% (IQ3) | 17.9% | 12.6% |
| Interquartile Range (IQR) | 5.2% | 3.0% |
| Standard Deviation (Sample) | 7.7% | 3.2% |
| Standard Deviation (Population) | 7.6% | 3.1% |
Similar Demographics by Disability
Demographics Similar to Arapaho by Disability
In terms of disability, the demographic groups most similar to Arapaho are Immigrants from Micronesia (13.2%, a difference of 0.21%), Pennsylvania German (13.2%, a difference of 0.29%), French (13.2%, a difference of 0.34%), Alaska Native (13.2%, a difference of 0.36%), and Hopi (13.2%, a difference of 0.37%).
| Demographics | Rating | Rank | Disability |
| Immigrants | Nonimmigrants | 0.0 /100 | #295 | Tragic 13.2% |
| Central American Indians | 0.0 /100 | #296 | Tragic 13.2% |
| Hopi | 0.0 /100 | #297 | Tragic 13.2% |
| Alaska Natives | 0.0 /100 | #298 | Tragic 13.2% |
| French | 0.0 /100 | #299 | Tragic 13.2% |
| Pennsylvania Germans | 0.0 /100 | #300 | Tragic 13.2% |
| Immigrants | Micronesia | 0.0 /100 | #301 | Tragic 13.2% |
| Arapaho | 0.0 /100 | #302 | Tragic 13.2% |
| Scotch-Irish | 0.0 /100 | #303 | Tragic 13.3% |
| Yakama | 0.0 /100 | #304 | Tragic 13.4% |
| French Canadians | 0.0 /100 | #305 | Tragic 13.4% |
| Cape Verdeans | 0.0 /100 | #306 | Tragic 13.5% |
| Shoshone | 0.0 /100 | #307 | Tragic 13.5% |
| French American Indians | 0.0 /100 | #308 | Tragic 13.5% |
| Tlingit-Haida | 0.0 /100 | #309 | Tragic 13.5% |
Demographics Similar to Immigrants from Eritrea by Disability
In terms of disability, the demographic groups most similar to Immigrants from Eritrea are Immigrants from Northern Africa (10.9%, a difference of 0.020%), Immigrants from Bulgaria (10.9%, a difference of 0.060%), Zimbabwean (10.9%, a difference of 0.11%), Immigrants from Sweden (11.0%, a difference of 0.18%), and Bulgarian (11.0%, a difference of 0.20%).
| Demographics | Rating | Rank | Disability |
| Immigrants | Lithuania | 99.8 /100 | #56 | Exceptional 10.9% |
| Salvadorans | 99.8 /100 | #57 | Exceptional 10.9% |
| Immigrants | South America | 99.8 /100 | #58 | Exceptional 10.9% |
| Immigrants | Colombia | 99.7 /100 | #59 | Exceptional 10.9% |
| Zimbabweans | 99.7 /100 | #60 | Exceptional 10.9% |
| Immigrants | Bulgaria | 99.7 /100 | #61 | Exceptional 10.9% |
| Immigrants | Northern Africa | 99.7 /100 | #62 | Exceptional 10.9% |
| Immigrants | Eritrea | 99.7 /100 | #63 | Exceptional 11.0% |
| Immigrants | Sweden | 99.6 /100 | #64 | Exceptional 11.0% |
| Bulgarians | 99.6 /100 | #65 | Exceptional 11.0% |
| Laotians | 99.6 /100 | #66 | Exceptional 11.0% |
| Colombians | 99.6 /100 | #67 | Exceptional 11.0% |
| Immigrants | Afghanistan | 99.6 /100 | #68 | Exceptional 11.0% |
| Sri Lankans | 99.5 /100 | #69 | Exceptional 11.0% |
| Immigrants | France | 99.4 /100 | #70 | Exceptional 11.0% |