Tlingit-Haida vs Immigrants from Eritrea In Labor Force | Age 35-44
COMPARE
Tlingit-Haida
Immigrants from Eritrea
In Labor Force | Age 35-44
In Labor Force | Age 35-44 Comparison
Tlingit-Haida
Immigrants from Eritrea
82.5%
IN LABOR FORCE | AGE 35-44
0.0/ 100
METRIC RATING
299th/ 347
METRIC RANK
85.2%
IN LABOR FORCE | AGE 35-44
99.7/ 100
METRIC RATING
48th/ 347
METRIC RANK
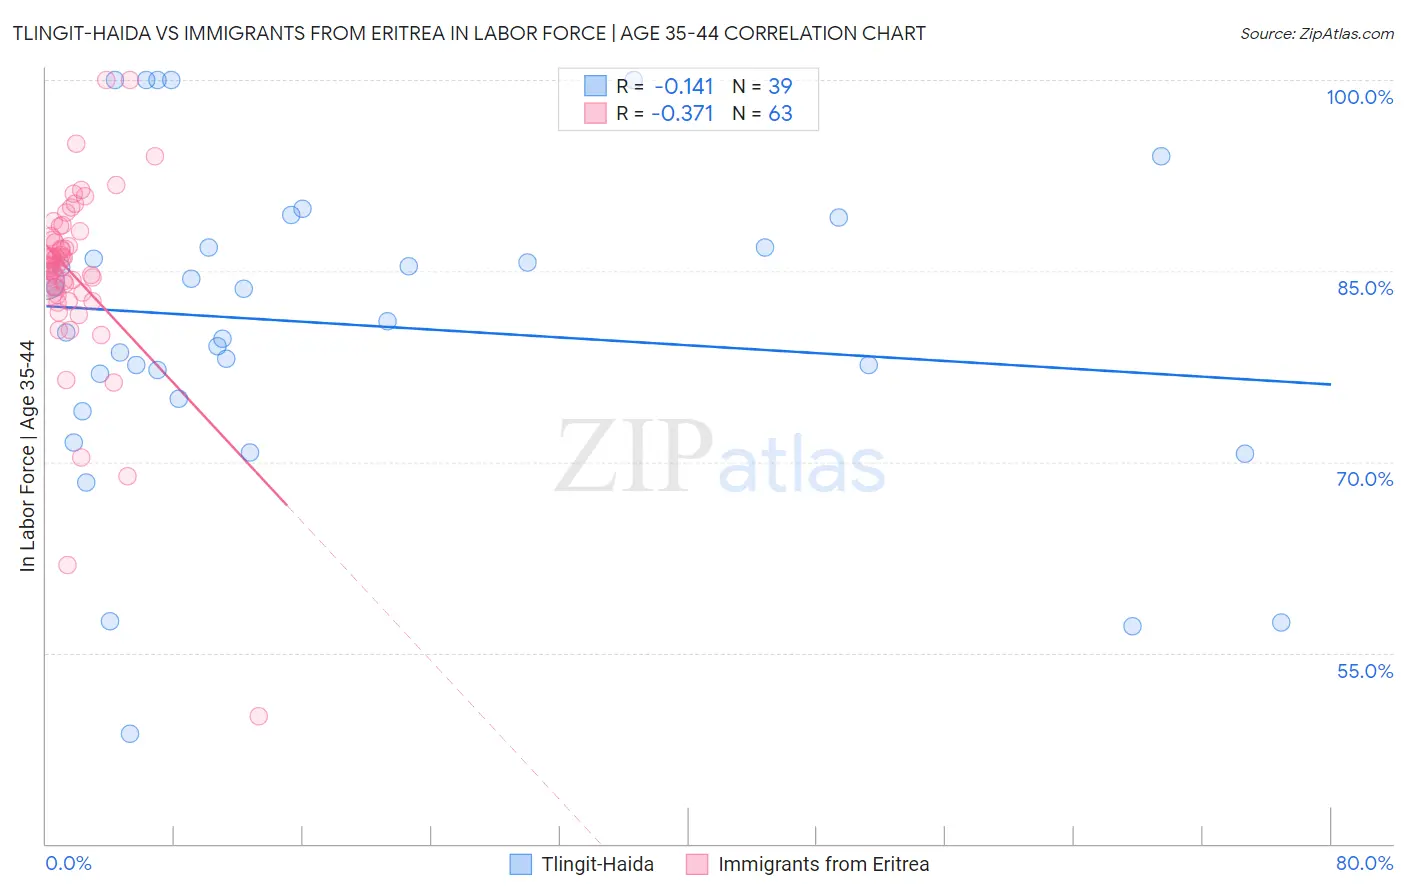
Tlingit-Haida vs Immigrants from Eritrea In Labor Force | Age 35-44 Correlation Chart
The statistical analysis conducted on geographies consisting of 60,871,811 people shows a poor negative correlation between the proportion of Tlingit-Haida and labor force participation rate among population between the ages 35 and 44 in the United States with a correlation coefficient (R) of -0.141 and weighted average of 82.5%. Similarly, the statistical analysis conducted on geographies consisting of 104,844,448 people shows a mild negative correlation between the proportion of Immigrants from Eritrea and labor force participation rate among population between the ages 35 and 44 in the United States with a correlation coefficient (R) of -0.371 and weighted average of 85.2%, a difference of 3.2%.
In Labor Force | Age 35-44 Correlation Summary
| Measurement | Tlingit-Haida | Immigrants from Eritrea |
| Minimum | 48.6% | 50.0% |
| Maximum | 100.0% | 100.0% |
| Range | 51.4% | 50.0% |
| Mean | 80.8% | 84.7% |
| Median | 81.0% | 85.5% |
| Interquartile 25% (IQ1) | 75.0% | 83.3% |
| Interquartile 75% (IQ3) | 86.8% | 87.7% |
| Interquartile Range (IQR) | 11.8% | 4.4% |
| Standard Deviation (Sample) | 12.3% | 7.5% |
| Standard Deviation (Population) | 12.1% | 7.4% |
Similar Demographics by In Labor Force | Age 35-44
Demographics Similar to Tlingit-Haida by In Labor Force | Age 35-44
In terms of in labor force | age 35-44, the demographic groups most similar to Tlingit-Haida are Ottawa (82.6%, a difference of 0.010%), Hmong (82.6%, a difference of 0.030%), Mexican American Indian (82.6%, a difference of 0.040%), Central American Indian (82.5%, a difference of 0.070%), and Spanish American Indian (82.5%, a difference of 0.090%).
| Demographics | Rating | Rank | In Labor Force | Age 35-44 |
| Immigrants | Latin America | 0.0 /100 | #292 | Tragic 82.8% |
| Spanish Americans | 0.0 /100 | #293 | Tragic 82.8% |
| Potawatomi | 0.0 /100 | #294 | Tragic 82.7% |
| Immigrants | Lebanon | 0.0 /100 | #295 | Tragic 82.7% |
| Mexican American Indians | 0.0 /100 | #296 | Tragic 82.6% |
| Hmong | 0.0 /100 | #297 | Tragic 82.6% |
| Ottawa | 0.0 /100 | #298 | Tragic 82.6% |
| Tlingit-Haida | 0.0 /100 | #299 | Tragic 82.5% |
| Central American Indians | 0.0 /100 | #300 | Tragic 82.5% |
| Spanish American Indians | 0.0 /100 | #301 | Tragic 82.5% |
| Americans | 0.0 /100 | #302 | Tragic 82.4% |
| Nepalese | 0.0 /100 | #303 | Tragic 82.4% |
| Marshallese | 0.0 /100 | #304 | Tragic 82.4% |
| Shoshone | 0.0 /100 | #305 | Tragic 82.2% |
| Blacks/African Americans | 0.0 /100 | #306 | Tragic 82.2% |
Demographics Similar to Immigrants from Eritrea by In Labor Force | Age 35-44
In terms of in labor force | age 35-44, the demographic groups most similar to Immigrants from Eritrea are Croatian (85.2%, a difference of 0.0%), German Russian (85.2%, a difference of 0.010%), Cypriot (85.2%, a difference of 0.020%), Immigrants from Hong Kong (85.2%, a difference of 0.020%), and Thai (85.2%, a difference of 0.030%).
| Demographics | Rating | Rank | In Labor Force | Age 35-44 |
| Immigrants | Zimbabwe | 99.8 /100 | #41 | Exceptional 85.2% |
| Macedonians | 99.8 /100 | #42 | Exceptional 85.2% |
| Poles | 99.8 /100 | #43 | Exceptional 85.2% |
| Lithuanians | 99.8 /100 | #44 | Exceptional 85.2% |
| Cypriots | 99.8 /100 | #45 | Exceptional 85.2% |
| Immigrants | Hong Kong | 99.8 /100 | #46 | Exceptional 85.2% |
| German Russians | 99.8 /100 | #47 | Exceptional 85.2% |
| Immigrants | Eritrea | 99.7 /100 | #48 | Exceptional 85.2% |
| Croatians | 99.7 /100 | #49 | Exceptional 85.2% |
| Thais | 99.7 /100 | #50 | Exceptional 85.2% |
| Immigrants | Albania | 99.7 /100 | #51 | Exceptional 85.1% |
| Immigrants | Kenya | 99.6 /100 | #52 | Exceptional 85.1% |
| Taiwanese | 99.6 /100 | #53 | Exceptional 85.1% |
| Turks | 99.5 /100 | #54 | Exceptional 85.1% |
| Soviet Union | 99.5 /100 | #55 | Exceptional 85.1% |