Tsimshian vs Immigrants from Eritrea Disability
COMPARE
Tsimshian
Immigrants from Eritrea
Disability
Disability Comparison
Tsimshian
Immigrants from Eritrea
16.1%
DISABILITY
0.0/ 100
METRIC RATING
346th/ 347
METRIC RANK
11.0%
DISABILITY
99.7/ 100
METRIC RATING
63rd/ 347
METRIC RANK
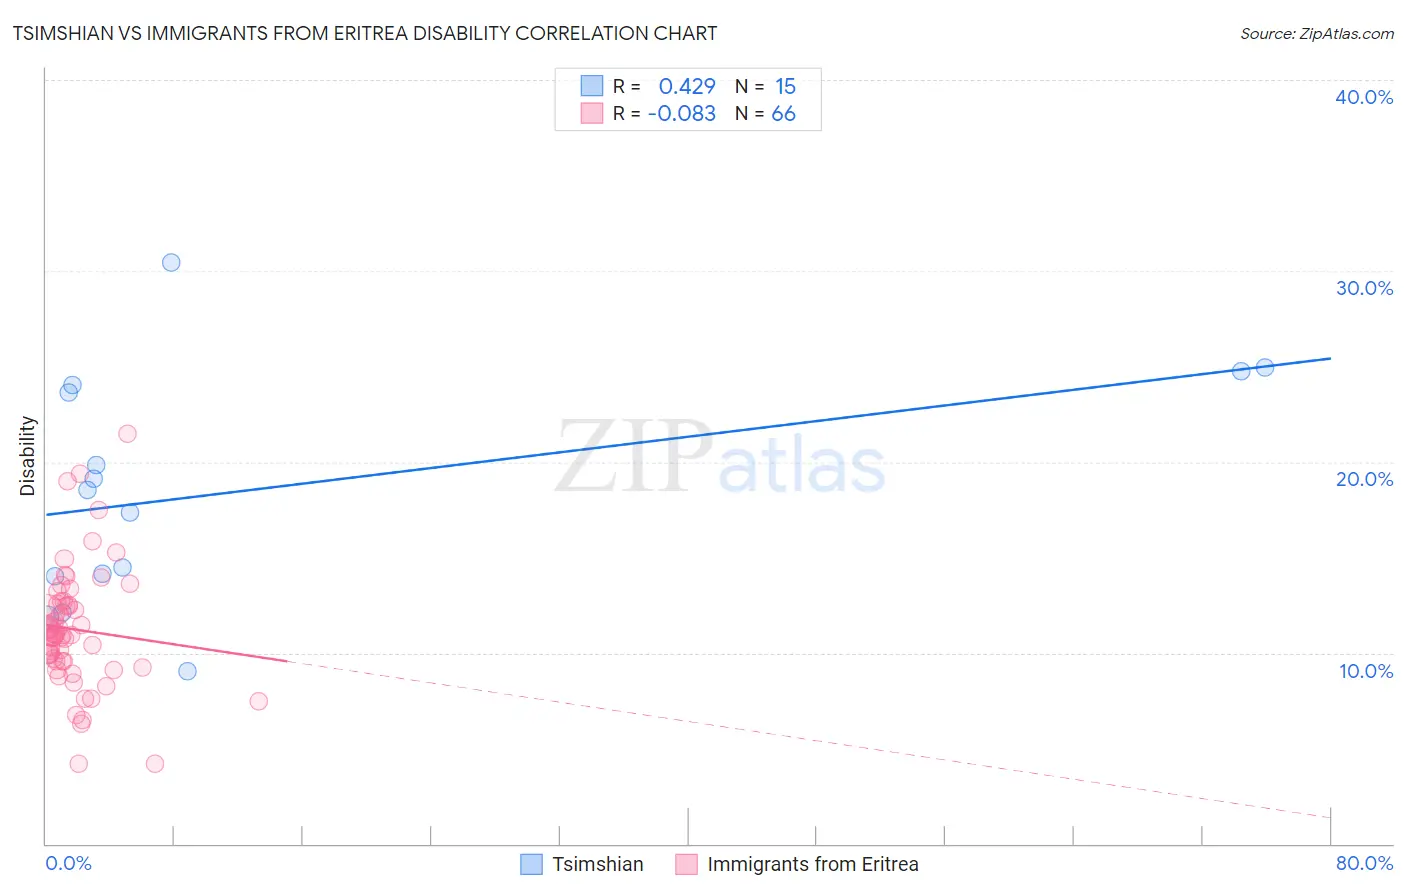
Tsimshian vs Immigrants from Eritrea Disability Correlation Chart
The statistical analysis conducted on geographies consisting of 15,626,544 people shows a moderate positive correlation between the proportion of Tsimshian and percentage of population with a disability in the United States with a correlation coefficient (R) of 0.429 and weighted average of 16.1%. Similarly, the statistical analysis conducted on geographies consisting of 104,852,788 people shows a slight negative correlation between the proportion of Immigrants from Eritrea and percentage of population with a disability in the United States with a correlation coefficient (R) of -0.083 and weighted average of 11.0%, a difference of 47.4%.
Disability Correlation Summary
| Measurement | Tsimshian | Immigrants from Eritrea |
| Minimum | 9.0% | 4.2% |
| Maximum | 30.5% | 21.4% |
| Range | 21.5% | 17.2% |
| Mean | 18.5% | 11.2% |
| Median | 18.5% | 10.9% |
| Interquartile 25% (IQ1) | 14.0% | 9.6% |
| Interquartile 75% (IQ3) | 24.0% | 12.6% |
| Interquartile Range (IQR) | 10.0% | 3.0% |
| Standard Deviation (Sample) | 6.1% | 3.2% |
| Standard Deviation (Population) | 5.9% | 3.1% |
Similar Demographics by Disability
Demographics Similar to Tsimshian by Disability
In terms of disability, the demographic groups most similar to Tsimshian are Puerto Rican (16.1%, a difference of 0.16%), Colville (15.8%, a difference of 2.2%), Creek (15.6%, a difference of 3.5%), Kiowa (15.6%, a difference of 3.5%), and Lumbee (15.5%, a difference of 3.9%).
| Demographics | Rating | Rank | Disability |
| Cajuns | 0.0 /100 | #333 | Tragic 14.6% |
| Yuman | 0.0 /100 | #334 | Tragic 14.6% |
| Tohono O'odham | 0.0 /100 | #335 | Tragic 14.8% |
| Cherokee | 0.0 /100 | #336 | Tragic 14.8% |
| Seminole | 0.0 /100 | #337 | Tragic 14.9% |
| Dutch West Indians | 0.0 /100 | #338 | Tragic 14.9% |
| Chickasaw | 0.0 /100 | #339 | Tragic 15.2% |
| Choctaw | 0.0 /100 | #340 | Tragic 15.4% |
| Lumbee | 0.0 /100 | #341 | Tragic 15.5% |
| Kiowa | 0.0 /100 | #342 | Tragic 15.6% |
| Creek | 0.0 /100 | #343 | Tragic 15.6% |
| Colville | 0.0 /100 | #344 | Tragic 15.8% |
| Puerto Ricans | 0.0 /100 | #345 | Tragic 16.1% |
| Tsimshian | 0.0 /100 | #346 | Tragic 16.1% |
| Houma | 0.0 /100 | #347 | Tragic 17.1% |
Demographics Similar to Immigrants from Eritrea by Disability
In terms of disability, the demographic groups most similar to Immigrants from Eritrea are Immigrants from Northern Africa (10.9%, a difference of 0.020%), Immigrants from Bulgaria (10.9%, a difference of 0.060%), Zimbabwean (10.9%, a difference of 0.11%), Immigrants from Sweden (11.0%, a difference of 0.18%), and Bulgarian (11.0%, a difference of 0.20%).
| Demographics | Rating | Rank | Disability |
| Immigrants | Lithuania | 99.8 /100 | #56 | Exceptional 10.9% |
| Salvadorans | 99.8 /100 | #57 | Exceptional 10.9% |
| Immigrants | South America | 99.8 /100 | #58 | Exceptional 10.9% |
| Immigrants | Colombia | 99.7 /100 | #59 | Exceptional 10.9% |
| Zimbabweans | 99.7 /100 | #60 | Exceptional 10.9% |
| Immigrants | Bulgaria | 99.7 /100 | #61 | Exceptional 10.9% |
| Immigrants | Northern Africa | 99.7 /100 | #62 | Exceptional 10.9% |
| Immigrants | Eritrea | 99.7 /100 | #63 | Exceptional 11.0% |
| Immigrants | Sweden | 99.6 /100 | #64 | Exceptional 11.0% |
| Bulgarians | 99.6 /100 | #65 | Exceptional 11.0% |
| Laotians | 99.6 /100 | #66 | Exceptional 11.0% |
| Colombians | 99.6 /100 | #67 | Exceptional 11.0% |
| Immigrants | Afghanistan | 99.6 /100 | #68 | Exceptional 11.0% |
| Sri Lankans | 99.5 /100 | #69 | Exceptional 11.0% |
| Immigrants | France | 99.4 /100 | #70 | Exceptional 11.0% |