Tlingit-Haida vs Immigrants from Eritrea College, 1 year or more
COMPARE
Tlingit-Haida
Immigrants from Eritrea
College, 1 year or more
College, 1 year or more Comparison
Tlingit-Haida
Immigrants from Eritrea
59.4%
COLLEGE, 1 YEAR OR MORE
48.4/ 100
METRIC RATING
177th/ 347
METRIC RANK
60.7%
COLLEGE, 1 YEAR OR MORE
84.3/ 100
METRIC RATING
139th/ 347
METRIC RANK
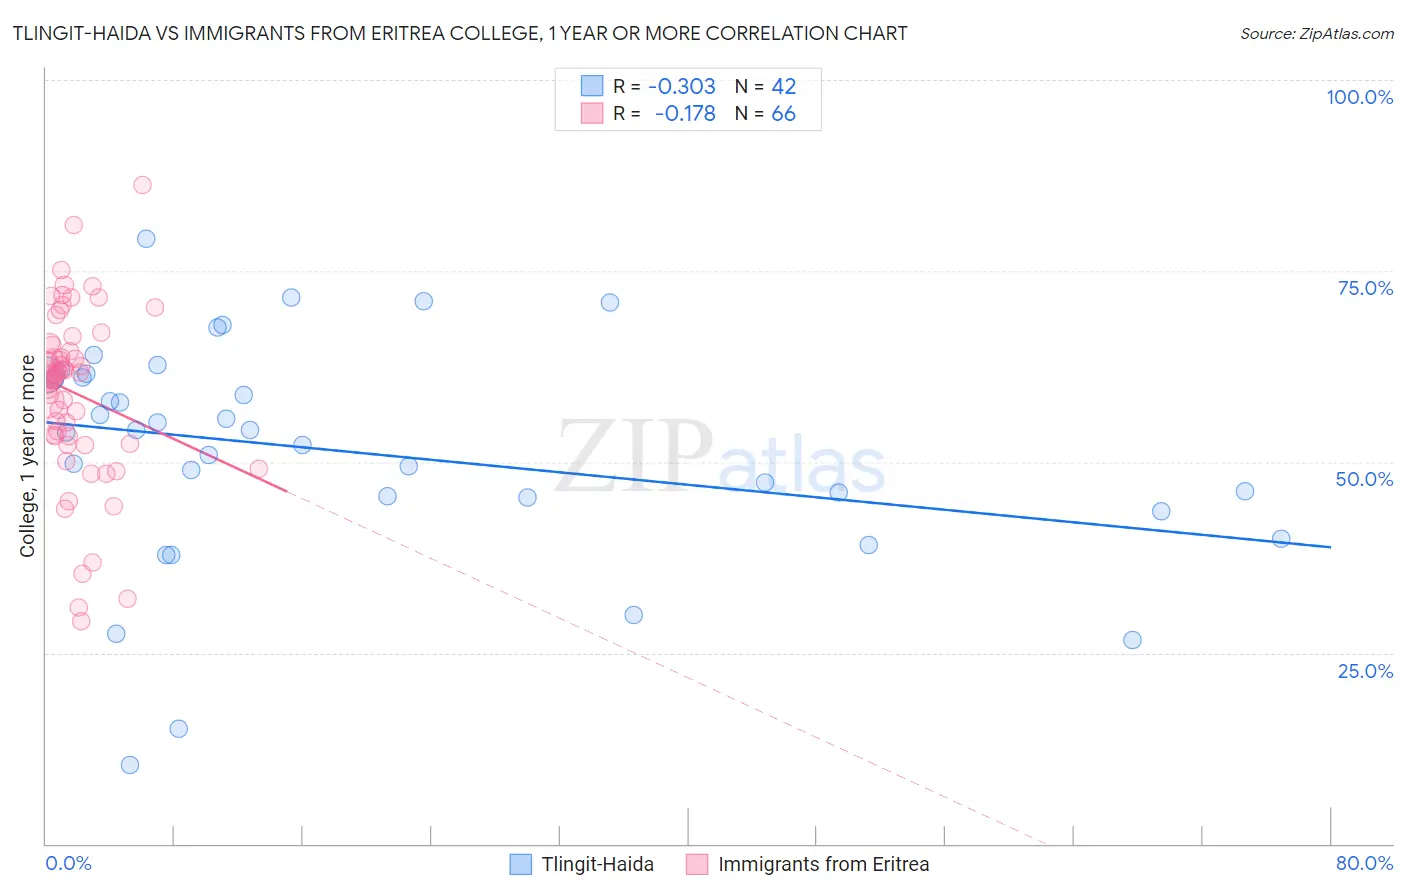
Tlingit-Haida vs Immigrants from Eritrea College, 1 year or more Correlation Chart
The statistical analysis conducted on geographies consisting of 60,872,339 people shows a mild negative correlation between the proportion of Tlingit-Haida and percentage of population with at least college, 1 year or more education in the United States with a correlation coefficient (R) of -0.303 and weighted average of 59.4%. Similarly, the statistical analysis conducted on geographies consisting of 104,852,788 people shows a poor negative correlation between the proportion of Immigrants from Eritrea and percentage of population with at least college, 1 year or more education in the United States with a correlation coefficient (R) of -0.178 and weighted average of 60.7%, a difference of 2.3%.
College, 1 year or more Correlation Summary
| Measurement | Tlingit-Haida | Immigrants from Eritrea |
| Minimum | 10.3% | 29.1% |
| Maximum | 79.3% | 86.2% |
| Range | 69.0% | 57.1% |
| Mean | 51.3% | 59.0% |
| Median | 54.0% | 61.3% |
| Interquartile 25% (IQ1) | 45.3% | 53.3% |
| Interquartile 75% (IQ3) | 61.5% | 65.3% |
| Interquartile Range (IQR) | 16.1% | 12.0% |
| Standard Deviation (Sample) | 14.8% | 11.3% |
| Standard Deviation (Population) | 14.6% | 11.3% |
Similar Demographics by College, 1 year or more
Demographics Similar to Tlingit-Haida by College, 1 year or more
In terms of college, 1 year or more, the demographic groups most similar to Tlingit-Haida are Czechoslovakian (59.4%, a difference of 0.0%), Sri Lankan (59.4%, a difference of 0.030%), Immigrants from Poland (59.4%, a difference of 0.030%), Celtic (59.4%, a difference of 0.080%), and Bermudan (59.3%, a difference of 0.10%).
| Demographics | Rating | Rank | College, 1 year or more |
| Welsh | 52.4 /100 | #170 | Average 59.5% |
| Immigrants | Albania | 52.3 /100 | #171 | Average 59.5% |
| Immigrants | Sierra Leone | 52.2 /100 | #172 | Average 59.5% |
| Immigrants | Oceania | 51.2 /100 | #173 | Average 59.4% |
| Celtics | 50.0 /100 | #174 | Average 59.4% |
| Sri Lankans | 49.0 /100 | #175 | Average 59.4% |
| Immigrants | Poland | 48.9 /100 | #176 | Average 59.4% |
| Tlingit-Haida | 48.4 /100 | #177 | Average 59.4% |
| Czechoslovakians | 48.3 /100 | #178 | Average 59.4% |
| Bermudans | 46.6 /100 | #179 | Average 59.3% |
| Yugoslavians | 44.1 /100 | #180 | Average 59.2% |
| Swiss | 43.4 /100 | #181 | Average 59.2% |
| Immigrants | Bosnia and Herzegovina | 42.8 /100 | #182 | Average 59.2% |
| German Russians | 39.3 /100 | #183 | Fair 59.1% |
| Spaniards | 38.3 /100 | #184 | Fair 59.0% |
Demographics Similar to Immigrants from Eritrea by College, 1 year or more
In terms of college, 1 year or more, the demographic groups most similar to Immigrants from Eritrea are Taiwanese (60.7%, a difference of 0.0%), Iraqi (60.7%, a difference of 0.090%), Immigrants from Afghanistan (60.7%, a difference of 0.11%), Polish (60.7%, a difference of 0.14%), and Canadian (60.6%, a difference of 0.15%).
| Demographics | Rating | Rank | College, 1 year or more |
| Scandinavians | 88.2 /100 | #132 | Excellent 61.0% |
| Immigrants | Uzbekistan | 88.0 /100 | #133 | Excellent 61.0% |
| Immigrants | Venezuela | 87.9 /100 | #134 | Excellent 61.0% |
| Immigrants | Uganda | 87.4 /100 | #135 | Excellent 60.9% |
| Basques | 87.2 /100 | #136 | Excellent 60.9% |
| Slovenes | 86.5 /100 | #137 | Excellent 60.9% |
| Taiwanese | 84.3 /100 | #138 | Excellent 60.7% |
| Immigrants | Eritrea | 84.3 /100 | #139 | Excellent 60.7% |
| Iraqis | 83.3 /100 | #140 | Excellent 60.7% |
| Immigrants | Afghanistan | 83.1 /100 | #141 | Excellent 60.7% |
| Poles | 82.8 /100 | #142 | Excellent 60.7% |
| Canadians | 82.7 /100 | #143 | Excellent 60.6% |
| Czechs | 81.9 /100 | #144 | Excellent 60.6% |
| Slavs | 81.1 /100 | #145 | Excellent 60.6% |
| Scottish | 80.2 /100 | #146 | Excellent 60.5% |