Norwegian vs Immigrants from Eastern Africa Male Disability
COMPARE
Norwegian
Immigrants from Eastern Africa
Male Disability
Male Disability Comparison
Norwegians
Immigrants from Eastern Africa
12.2%
MALE DISABILITY
0.2/ 100
METRIC RATING
262nd/ 347
METRIC RANK
10.8%
MALE DISABILITY
94.3/ 100
METRIC RATING
107th/ 347
METRIC RANK
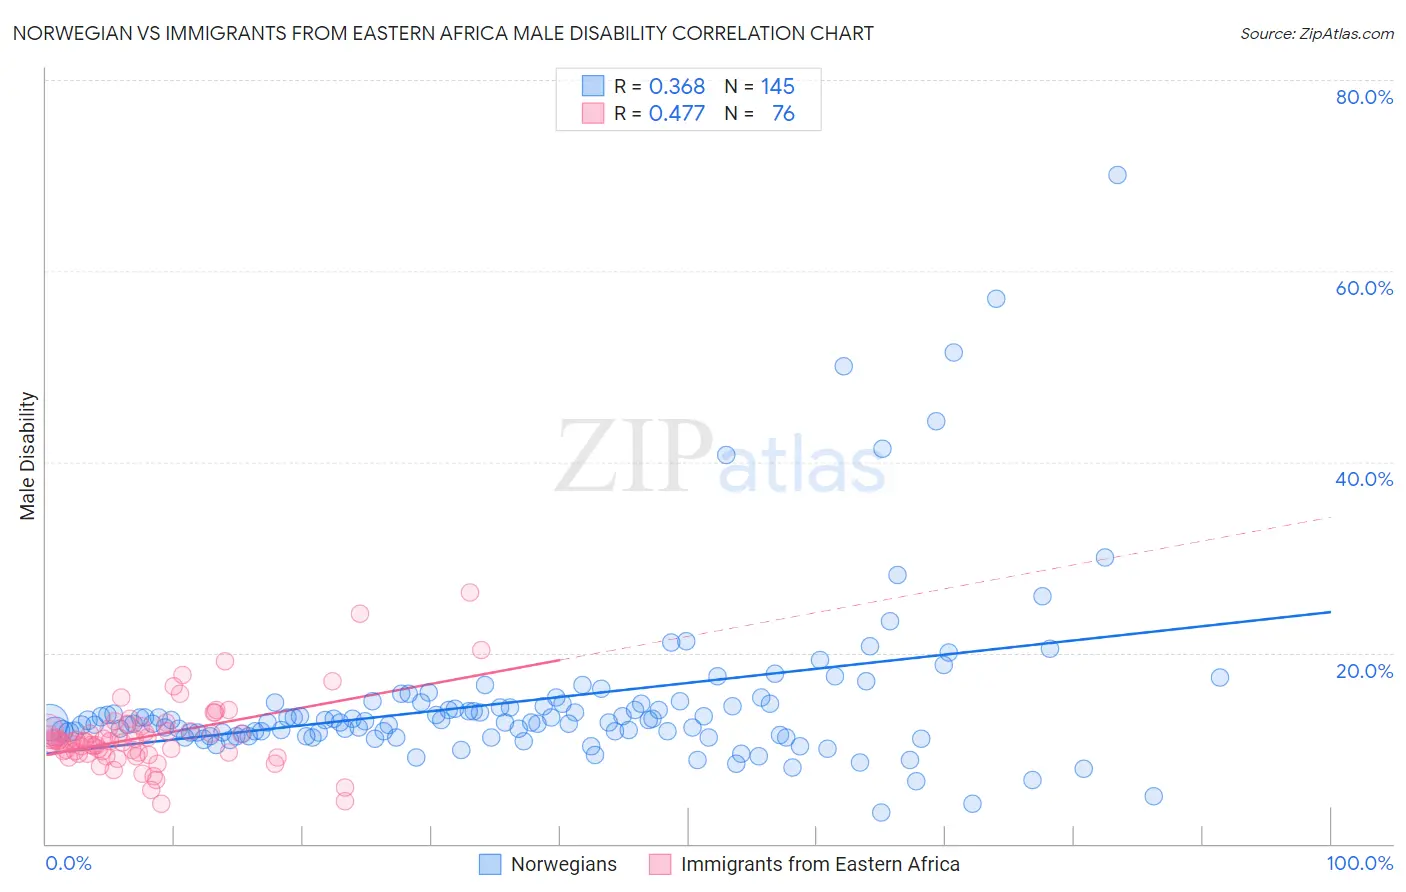
Norwegian vs Immigrants from Eastern Africa Male Disability Correlation Chart
The statistical analysis conducted on geographies consisting of 533,169,382 people shows a mild positive correlation between the proportion of Norwegians and percentage of males with a disability in the United States with a correlation coefficient (R) of 0.368 and weighted average of 12.2%. Similarly, the statistical analysis conducted on geographies consisting of 355,104,040 people shows a moderate positive correlation between the proportion of Immigrants from Eastern Africa and percentage of males with a disability in the United States with a correlation coefficient (R) of 0.477 and weighted average of 10.8%, a difference of 12.9%.
Male Disability Correlation Summary
| Measurement | Norwegian | Immigrants from Eastern Africa |
| Minimum | 3.3% | 4.2% |
| Maximum | 70.0% | 26.3% |
| Range | 66.7% | 22.2% |
| Mean | 15.0% | 11.3% |
| Median | 12.8% | 10.8% |
| Interquartile 25% (IQ1) | 11.5% | 9.5% |
| Interquartile 75% (IQ3) | 14.7% | 12.0% |
| Interquartile Range (IQR) | 3.2% | 2.5% |
| Standard Deviation (Sample) | 9.1% | 3.7% |
| Standard Deviation (Population) | 9.1% | 3.7% |
Similar Demographics by Male Disability
Demographics Similar to Norwegians by Male Disability
In terms of male disability, the demographic groups most similar to Norwegians are Slavic (12.2%, a difference of 0.010%), Canadian (12.2%, a difference of 0.20%), Nepalese (12.2%, a difference of 0.23%), Swedish (12.1%, a difference of 0.37%), and Belgian (12.1%, a difference of 0.44%).
| Demographics | Rating | Rank | Male Disability |
| Chinese | 0.4 /100 | #255 | Tragic 12.1% |
| Swiss | 0.3 /100 | #256 | Tragic 12.1% |
| Europeans | 0.3 /100 | #257 | Tragic 12.1% |
| Basques | 0.3 /100 | #258 | Tragic 12.1% |
| Belgians | 0.3 /100 | #259 | Tragic 12.1% |
| Swedes | 0.3 /100 | #260 | Tragic 12.1% |
| Slavs | 0.2 /100 | #261 | Tragic 12.2% |
| Norwegians | 0.2 /100 | #262 | Tragic 12.2% |
| Canadians | 0.2 /100 | #263 | Tragic 12.2% |
| Nepalese | 0.2 /100 | #264 | Tragic 12.2% |
| Immigrants | Portugal | 0.1 /100 | #265 | Tragic 12.3% |
| Hawaiians | 0.1 /100 | #266 | Tragic 12.3% |
| Immigrants | Germany | 0.1 /100 | #267 | Tragic 12.3% |
| Portuguese | 0.1 /100 | #268 | Tragic 12.3% |
| Czechoslovakians | 0.1 /100 | #269 | Tragic 12.3% |
Demographics Similar to Immigrants from Eastern Africa by Male Disability
In terms of male disability, the demographic groups most similar to Immigrants from Eastern Africa are Immigrants from Belgium (10.8%, a difference of 0.020%), Immigrants from Uganda (10.8%, a difference of 0.070%), Immigrants (10.8%, a difference of 0.090%), Immigrants from Uruguay (10.8%, a difference of 0.13%), and Immigrants from Syria (10.8%, a difference of 0.18%).
| Demographics | Rating | Rank | Male Disability |
| Immigrants | Kazakhstan | 95.9 /100 | #100 | Exceptional 10.7% |
| Immigrants | Greece | 95.6 /100 | #101 | Exceptional 10.7% |
| Immigrants | Eastern Europe | 95.3 /100 | #102 | Exceptional 10.7% |
| Uruguayans | 95.3 /100 | #103 | Exceptional 10.7% |
| Immigrants | Nigeria | 95.1 /100 | #104 | Exceptional 10.8% |
| Immigrants | Brazil | 95.0 /100 | #105 | Exceptional 10.8% |
| Immigrants | Syria | 94.9 /100 | #106 | Exceptional 10.8% |
| Immigrants | Eastern Africa | 94.3 /100 | #107 | Exceptional 10.8% |
| Immigrants | Belgium | 94.2 /100 | #108 | Exceptional 10.8% |
| Immigrants | Uganda | 94.0 /100 | #109 | Exceptional 10.8% |
| Immigrants | Immigrants | 93.9 /100 | #110 | Exceptional 10.8% |
| Immigrants | Uruguay | 93.8 /100 | #111 | Exceptional 10.8% |
| Ghanaians | 93.4 /100 | #112 | Exceptional 10.8% |
| Immigrants | Zimbabwe | 93.0 /100 | #113 | Exceptional 10.8% |
| Central Americans | 92.7 /100 | #114 | Exceptional 10.8% |