Tlingit-Haida vs Immigrants from Bulgaria Vision Disability
COMPARE
Tlingit-Haida
Immigrants from Bulgaria
Vision Disability
Vision Disability Comparison
Tlingit-Haida
Immigrants from Bulgaria
2.9%
VISION DISABILITY
0.0/ 100
METRIC RATING
323rd/ 347
METRIC RANK
2.0%
VISION DISABILITY
99.7/ 100
METRIC RATING
47th/ 347
METRIC RANK
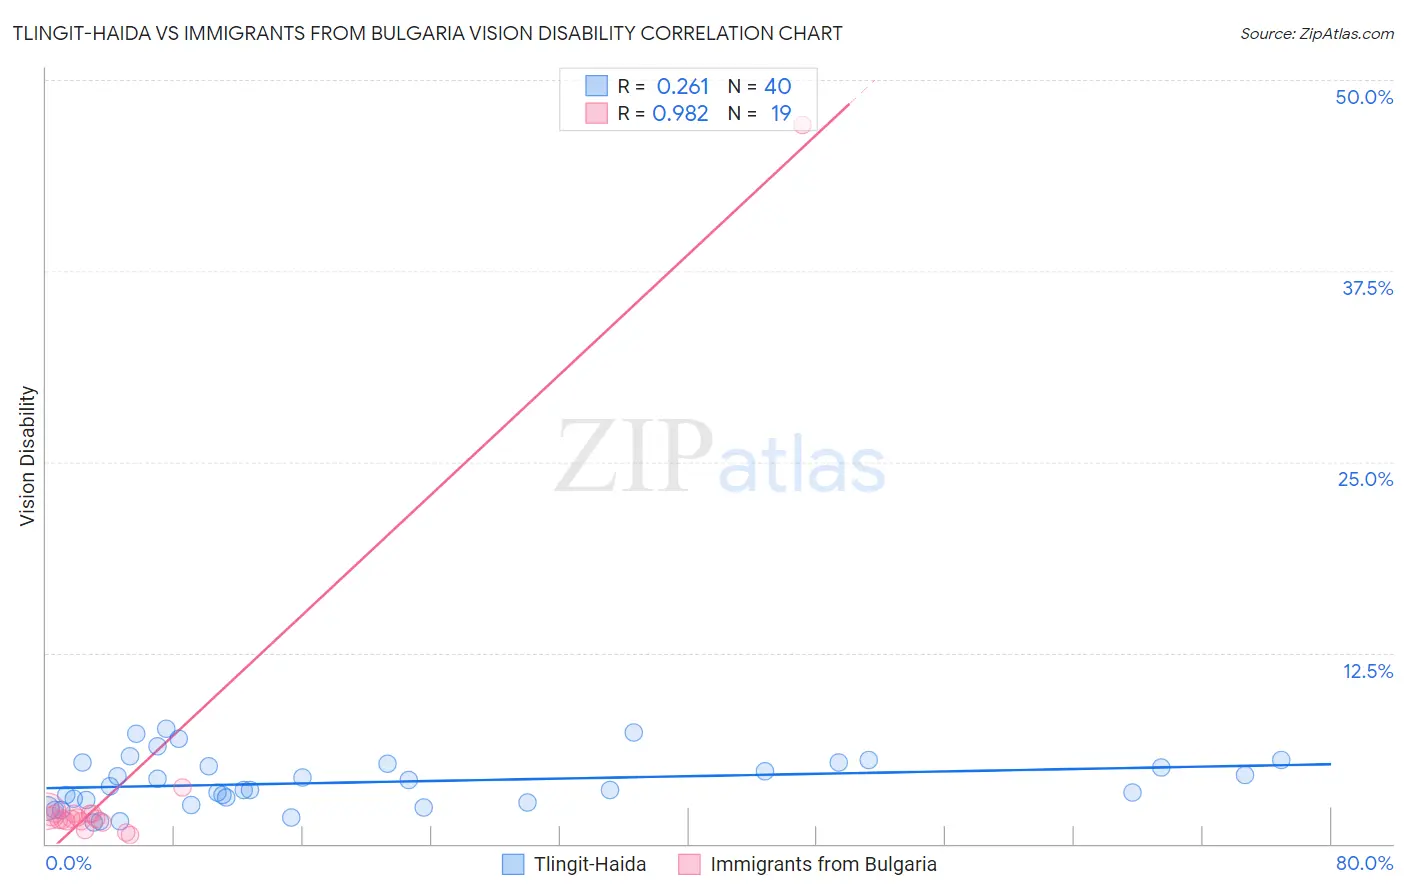
Tlingit-Haida vs Immigrants from Bulgaria Vision Disability Correlation Chart
The statistical analysis conducted on geographies consisting of 60,836,708 people shows a weak positive correlation between the proportion of Tlingit-Haida and percentage of population with vision disability in the United States with a correlation coefficient (R) of 0.261 and weighted average of 2.9%. Similarly, the statistical analysis conducted on geographies consisting of 172,526,022 people shows a perfect positive correlation between the proportion of Immigrants from Bulgaria and percentage of population with vision disability in the United States with a correlation coefficient (R) of 0.982 and weighted average of 2.0%, a difference of 44.7%.
Vision Disability Correlation Summary
| Measurement | Tlingit-Haida | Immigrants from Bulgaria |
| Minimum | 1.4% | 0.56% |
| Maximum | 7.5% | 47.1% |
| Range | 6.1% | 46.5% |
| Mean | 4.0% | 4.1% |
| Median | 3.7% | 1.6% |
| Interquartile 25% (IQ1) | 2.8% | 1.5% |
| Interquartile 75% (IQ3) | 5.3% | 2.0% |
| Interquartile Range (IQR) | 2.5% | 0.48% |
| Standard Deviation (Sample) | 1.7% | 10.4% |
| Standard Deviation (Population) | 1.7% | 10.2% |
Similar Demographics by Vision Disability
Demographics Similar to Tlingit-Haida by Vision Disability
In terms of vision disability, the demographic groups most similar to Tlingit-Haida are Paiute (2.9%, a difference of 0.0%), Comanche (2.8%, a difference of 0.42%), Hopi (2.9%, a difference of 2.0%), Cherokee (2.9%, a difference of 2.0%), and Black/African American (2.8%, a difference of 2.5%).
| Demographics | Rating | Rank | Vision Disability |
| Shoshone | 0.0 /100 | #316 | Tragic 2.7% |
| Yup'ik | 0.0 /100 | #317 | Tragic 2.7% |
| Alaska Natives | 0.0 /100 | #318 | Tragic 2.7% |
| Tohono O'odham | 0.0 /100 | #319 | Tragic 2.8% |
| Blacks/African Americans | 0.0 /100 | #320 | Tragic 2.8% |
| Comanche | 0.0 /100 | #321 | Tragic 2.8% |
| Paiute | 0.0 /100 | #322 | Tragic 2.9% |
| Tlingit-Haida | 0.0 /100 | #323 | Tragic 2.9% |
| Hopi | 0.0 /100 | #324 | Tragic 2.9% |
| Cherokee | 0.0 /100 | #325 | Tragic 2.9% |
| Spanish Americans | 0.0 /100 | #326 | Tragic 2.9% |
| Natives/Alaskans | 0.0 /100 | #327 | Tragic 3.0% |
| Yuman | 0.0 /100 | #328 | Tragic 3.0% |
| Apache | 0.0 /100 | #329 | Tragic 3.0% |
| Colville | 0.0 /100 | #330 | Tragic 3.0% |
Demographics Similar to Immigrants from Bulgaria by Vision Disability
In terms of vision disability, the demographic groups most similar to Immigrants from Bulgaria are Immigrants from Sweden (2.0%, a difference of 0.020%), Ethiopian (2.0%, a difference of 0.060%), Immigrants from Indonesia (2.0%, a difference of 0.090%), Eastern European (2.0%, a difference of 0.11%), and Immigrants from Ethiopia (2.0%, a difference of 0.17%).
| Demographics | Rating | Rank | Vision Disability |
| Immigrants | Ireland | 99.7 /100 | #40 | Exceptional 2.0% |
| Cypriots | 99.7 /100 | #41 | Exceptional 2.0% |
| Immigrants | Ethiopia | 99.7 /100 | #42 | Exceptional 2.0% |
| Eastern Europeans | 99.7 /100 | #43 | Exceptional 2.0% |
| Immigrants | Indonesia | 99.7 /100 | #44 | Exceptional 2.0% |
| Ethiopians | 99.7 /100 | #45 | Exceptional 2.0% |
| Immigrants | Sweden | 99.7 /100 | #46 | Exceptional 2.0% |
| Immigrants | Bulgaria | 99.7 /100 | #47 | Exceptional 2.0% |
| Israelis | 99.6 /100 | #48 | Exceptional 2.0% |
| Latvians | 99.5 /100 | #49 | Exceptional 2.0% |
| Afghans | 99.5 /100 | #50 | Exceptional 2.0% |
| Tongans | 99.5 /100 | #51 | Exceptional 2.0% |
| Immigrants | Serbia | 99.4 /100 | #52 | Exceptional 2.0% |
| Immigrants | Belarus | 99.3 /100 | #53 | Exceptional 2.0% |
| Macedonians | 99.3 /100 | #54 | Exceptional 2.0% |