Tlingit-Haida vs Pakistani Vision Disability
COMPARE
Tlingit-Haida
Pakistani
Vision Disability
Vision Disability Comparison
Tlingit-Haida
Pakistanis
2.9%
VISION DISABILITY
0.0/ 100
METRIC RATING
323rd/ 347
METRIC RANK
2.1%
VISION DISABILITY
71.6/ 100
METRIC RATING
156th/ 347
METRIC RANK
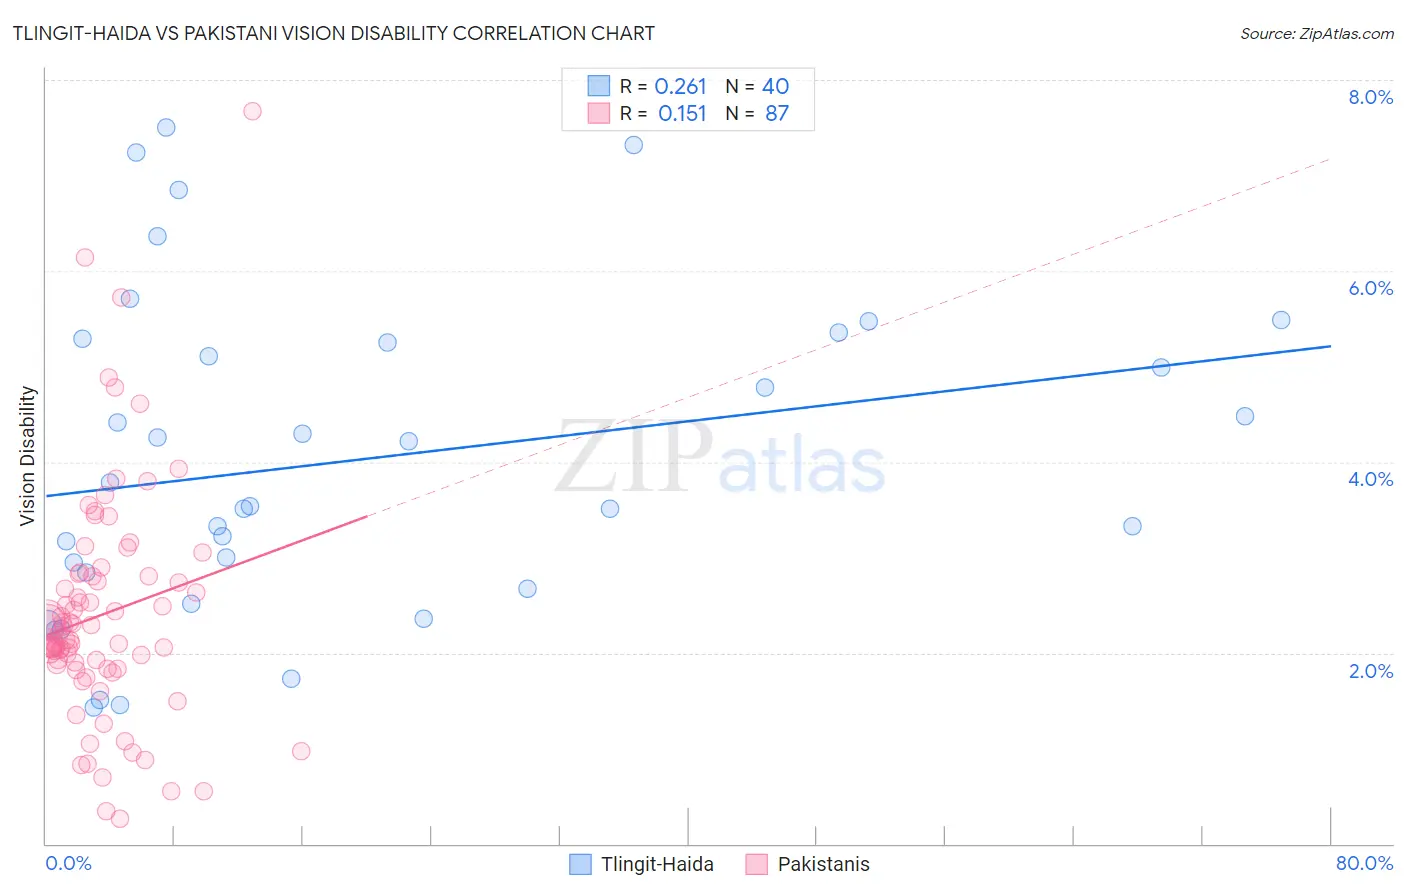
Tlingit-Haida vs Pakistani Vision Disability Correlation Chart
The statistical analysis conducted on geographies consisting of 60,836,708 people shows a weak positive correlation between the proportion of Tlingit-Haida and percentage of population with vision disability in the United States with a correlation coefficient (R) of 0.261 and weighted average of 2.9%. Similarly, the statistical analysis conducted on geographies consisting of 335,131,498 people shows a poor positive correlation between the proportion of Pakistanis and percentage of population with vision disability in the United States with a correlation coefficient (R) of 0.151 and weighted average of 2.1%, a difference of 33.7%.
Vision Disability Correlation Summary
| Measurement | Tlingit-Haida | Pakistani |
| Minimum | 1.4% | 0.26% |
| Maximum | 7.5% | 7.7% |
| Range | 6.1% | 7.4% |
| Mean | 4.0% | 2.4% |
| Median | 3.7% | 2.1% |
| Interquartile 25% (IQ1) | 2.8% | 1.8% |
| Interquartile 75% (IQ3) | 5.3% | 2.8% |
| Interquartile Range (IQR) | 2.5% | 0.96% |
| Standard Deviation (Sample) | 1.7% | 1.2% |
| Standard Deviation (Population) | 1.7% | 1.2% |
Similar Demographics by Vision Disability
Demographics Similar to Tlingit-Haida by Vision Disability
In terms of vision disability, the demographic groups most similar to Tlingit-Haida are Paiute (2.9%, a difference of 0.0%), Comanche (2.8%, a difference of 0.42%), Hopi (2.9%, a difference of 2.0%), Cherokee (2.9%, a difference of 2.0%), and Black/African American (2.8%, a difference of 2.5%).
| Demographics | Rating | Rank | Vision Disability |
| Shoshone | 0.0 /100 | #316 | Tragic 2.7% |
| Yup'ik | 0.0 /100 | #317 | Tragic 2.7% |
| Alaska Natives | 0.0 /100 | #318 | Tragic 2.7% |
| Tohono O'odham | 0.0 /100 | #319 | Tragic 2.8% |
| Blacks/African Americans | 0.0 /100 | #320 | Tragic 2.8% |
| Comanche | 0.0 /100 | #321 | Tragic 2.8% |
| Paiute | 0.0 /100 | #322 | Tragic 2.9% |
| Tlingit-Haida | 0.0 /100 | #323 | Tragic 2.9% |
| Hopi | 0.0 /100 | #324 | Tragic 2.9% |
| Cherokee | 0.0 /100 | #325 | Tragic 2.9% |
| Spanish Americans | 0.0 /100 | #326 | Tragic 2.9% |
| Natives/Alaskans | 0.0 /100 | #327 | Tragic 3.0% |
| Yuman | 0.0 /100 | #328 | Tragic 3.0% |
| Apache | 0.0 /100 | #329 | Tragic 3.0% |
| Colville | 0.0 /100 | #330 | Tragic 3.0% |
Demographics Similar to Pakistanis by Vision Disability
In terms of vision disability, the demographic groups most similar to Pakistanis are Immigrants from Colombia (2.1%, a difference of 0.040%), Serbian (2.1%, a difference of 0.11%), Immigrants from Uzbekistan (2.1%, a difference of 0.13%), South African (2.1%, a difference of 0.14%), and Slovene (2.1%, a difference of 0.16%).
| Demographics | Rating | Rank | Vision Disability |
| Colombians | 76.2 /100 | #149 | Good 2.1% |
| Belgians | 75.9 /100 | #150 | Good 2.1% |
| Immigrants | Norway | 75.5 /100 | #151 | Good 2.1% |
| Immigrants | Southern Europe | 74.6 /100 | #152 | Good 2.1% |
| Immigrants | South America | 73.8 /100 | #153 | Good 2.1% |
| Slovenes | 73.6 /100 | #154 | Good 2.1% |
| Immigrants | Colombia | 72.1 /100 | #155 | Good 2.1% |
| Pakistanis | 71.6 /100 | #156 | Good 2.1% |
| Serbians | 70.2 /100 | #157 | Good 2.1% |
| Immigrants | Uzbekistan | 69.9 /100 | #158 | Good 2.1% |
| South Africans | 69.8 /100 | #159 | Good 2.1% |
| Austrians | 69.0 /100 | #160 | Good 2.1% |
| Iraqis | 67.7 /100 | #161 | Good 2.1% |
| Hungarians | 67.4 /100 | #162 | Good 2.1% |
| Icelanders | 66.1 /100 | #163 | Good 2.1% |