Tlingit-Haida vs Immigrants from Afghanistan Householder Income Ages 45 - 64 years
COMPARE
Tlingit-Haida
Immigrants from Afghanistan
Householder Income Ages 45 - 64 years
Householder Income Ages 45 - 64 years Comparison
Tlingit-Haida
Immigrants from Afghanistan
$97,417
HOUSEHOLDER INCOME AGES 45 - 64 YEARS
18.9/ 100
METRIC RATING
202nd/ 347
METRIC RANK
$108,785
HOUSEHOLDER INCOME AGES 45 - 64 YEARS
98.6/ 100
METRIC RATING
85th/ 347
METRIC RANK
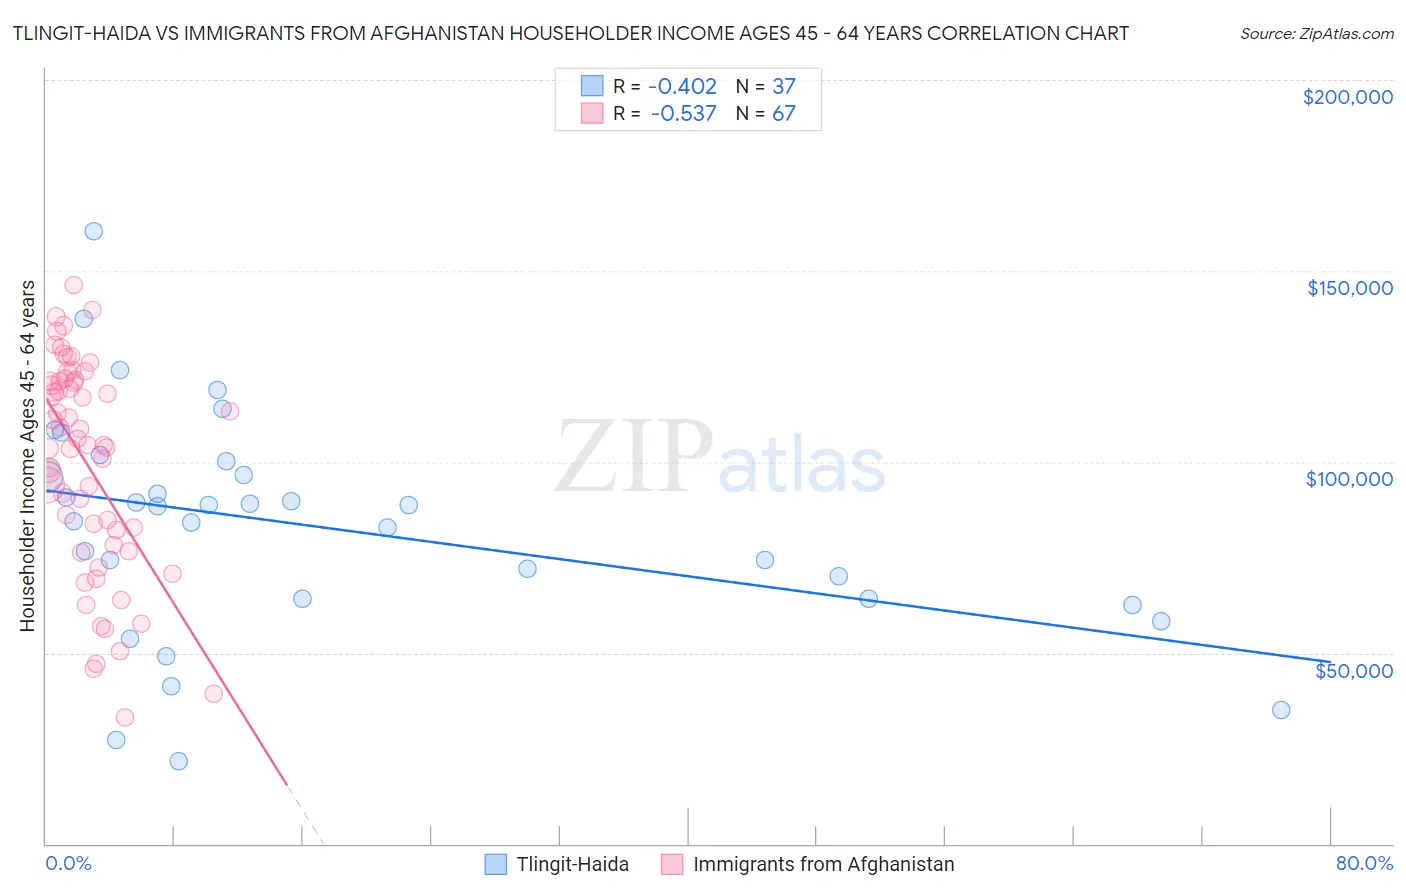
Tlingit-Haida vs Immigrants from Afghanistan Householder Income Ages 45 - 64 years Correlation Chart
The statistical analysis conducted on geographies consisting of 60,826,750 people shows a moderate negative correlation between the proportion of Tlingit-Haida and household income with householder between the ages 45 and 64 in the United States with a correlation coefficient (R) of -0.402 and weighted average of $97,417. Similarly, the statistical analysis conducted on geographies consisting of 147,616,456 people shows a substantial negative correlation between the proportion of Immigrants from Afghanistan and household income with householder between the ages 45 and 64 in the United States with a correlation coefficient (R) of -0.537 and weighted average of $108,785, a difference of 11.7%.
Householder Income Ages 45 - 64 years Correlation Summary
| Measurement | Tlingit-Haida | Immigrants from Afghanistan |
| Minimum | $21,563 | $33,125 |
| Maximum | $160,485 | $146,322 |
| Range | $138,922 | $113,197 |
| Mean | $83,137 | $99,596 |
| Median | $88,264 | $104,498 |
| Interquartile 25% (IQ1) | $64,077 | $78,229 |
| Interquartile 75% (IQ3) | $98,405 | $121,219 |
| Interquartile Range (IQR) | $34,328 | $42,990 |
| Standard Deviation (Sample) | $29,197 | $27,771 |
| Standard Deviation (Population) | $28,800 | $27,563 |
Similar Demographics by Householder Income Ages 45 - 64 years
Demographics Similar to Tlingit-Haida by Householder Income Ages 45 - 64 years
In terms of householder income ages 45 - 64 years, the demographic groups most similar to Tlingit-Haida are Immigrants from Thailand ($97,400, a difference of 0.020%), Immigrants from Eritrea ($97,373, a difference of 0.040%), Immigrants from Colombia ($97,290, a difference of 0.13%), Immigrants from Africa ($97,284, a difference of 0.14%), and Ghanaian ($97,277, a difference of 0.14%).
| Demographics | Rating | Rank | Householder Income Ages 45 - 64 years |
| Spanish | 29.2 /100 | #195 | Fair $98,554 |
| Immigrants | Eastern Africa | 28.3 /100 | #196 | Fair $98,467 |
| Puget Sound Salish | 27.0 /100 | #197 | Fair $98,340 |
| Immigrants | Iraq | 25.7 /100 | #198 | Fair $98,201 |
| Whites/Caucasians | 24.6 /100 | #199 | Fair $98,091 |
| Immigrants | Kenya | 23.5 /100 | #200 | Fair $97,964 |
| Yugoslavians | 20.0 /100 | #201 | Fair $97,558 |
| Tlingit-Haida | 18.9 /100 | #202 | Poor $97,417 |
| Immigrants | Thailand | 18.8 /100 | #203 | Poor $97,400 |
| Immigrants | Eritrea | 18.6 /100 | #204 | Poor $97,373 |
| Immigrants | Colombia | 18.0 /100 | #205 | Poor $97,290 |
| Immigrants | Africa | 17.9 /100 | #206 | Poor $97,284 |
| Ghanaians | 17.9 /100 | #207 | Poor $97,277 |
| Scotch-Irish | 16.4 /100 | #208 | Poor $97,073 |
| Japanese | 14.8 /100 | #209 | Poor $96,834 |
Demographics Similar to Immigrants from Afghanistan by Householder Income Ages 45 - 64 years
In terms of householder income ages 45 - 64 years, the demographic groups most similar to Immigrants from Afghanistan are Immigrants from Western Europe ($108,824, a difference of 0.040%), Austrian ($108,692, a difference of 0.090%), Tongan ($108,643, a difference of 0.13%), Romanian ($108,609, a difference of 0.16%), and Immigrants from Spain ($109,051, a difference of 0.24%).
| Demographics | Rating | Rank | Householder Income Ages 45 - 64 years |
| Immigrants | Canada | 99.0 /100 | #78 | Exceptional $109,402 |
| Immigrants | Bulgaria | 98.9 /100 | #79 | Exceptional $109,379 |
| Jordanians | 98.9 /100 | #80 | Exceptional $109,376 |
| Immigrants | Eastern Europe | 98.9 /100 | #81 | Exceptional $109,335 |
| Immigrants | North America | 98.8 /100 | #82 | Exceptional $109,198 |
| Immigrants | Spain | 98.8 /100 | #83 | Exceptional $109,051 |
| Immigrants | Western Europe | 98.6 /100 | #84 | Exceptional $108,824 |
| Immigrants | Afghanistan | 98.6 /100 | #85 | Exceptional $108,785 |
| Austrians | 98.5 /100 | #86 | Exceptional $108,692 |
| Tongans | 98.5 /100 | #87 | Exceptional $108,643 |
| Romanians | 98.5 /100 | #88 | Exceptional $108,609 |
| Ukrainians | 98.3 /100 | #89 | Exceptional $108,475 |
| Immigrants | Philippines | 98.3 /100 | #90 | Exceptional $108,471 |
| Immigrants | Lebanon | 98.3 /100 | #91 | Exceptional $108,471 |
| Croatians | 98.3 /100 | #92 | Exceptional $108,383 |