Immigrants from Israel vs Hungarian Ambulatory Disability
COMPARE
Immigrants from Israel
Hungarian
Ambulatory Disability
Ambulatory Disability Comparison
Immigrants from Israel
Hungarians
5.4%
AMBULATORY DISABILITY
100.0/ 100
METRIC RATING
22nd/ 347
METRIC RANK
6.3%
AMBULATORY DISABILITY
9.6/ 100
METRIC RATING
221st/ 347
METRIC RANK
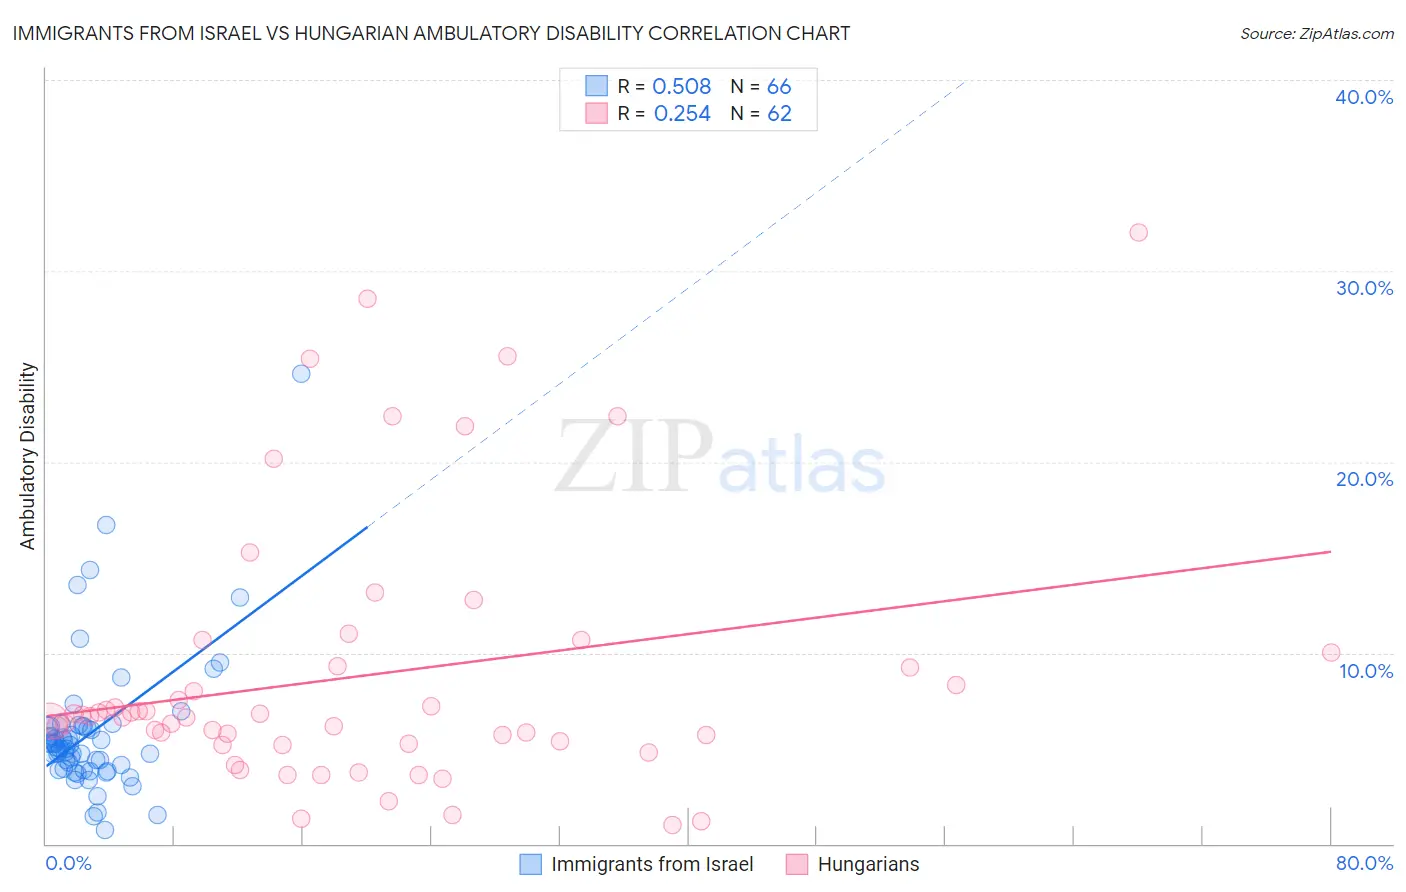
Immigrants from Israel vs Hungarian Ambulatory Disability Correlation Chart
The statistical analysis conducted on geographies consisting of 210,002,102 people shows a substantial positive correlation between the proportion of Immigrants from Israel and percentage of population with ambulatory disability in the United States with a correlation coefficient (R) of 0.508 and weighted average of 5.4%. Similarly, the statistical analysis conducted on geographies consisting of 486,018,761 people shows a weak positive correlation between the proportion of Hungarians and percentage of population with ambulatory disability in the United States with a correlation coefficient (R) of 0.254 and weighted average of 6.3%, a difference of 17.0%.
Ambulatory Disability Correlation Summary
| Measurement | Immigrants from Israel | Hungarian |
| Minimum | 0.69% | 1.0% |
| Maximum | 24.6% | 32.0% |
| Range | 24.0% | 31.0% |
| Mean | 5.8% | 8.8% |
| Median | 5.1% | 6.7% |
| Interquartile 25% (IQ1) | 3.9% | 5.2% |
| Interquartile 75% (IQ3) | 6.1% | 9.3% |
| Interquartile Range (IQR) | 2.2% | 4.1% |
| Standard Deviation (Sample) | 3.7% | 6.9% |
| Standard Deviation (Population) | 3.7% | 6.8% |
Similar Demographics by Ambulatory Disability
Demographics Similar to Immigrants from Israel by Ambulatory Disability
In terms of ambulatory disability, the demographic groups most similar to Immigrants from Israel are Tongan (5.4%, a difference of 0.040%), Immigrants from Saudi Arabia (5.4%, a difference of 0.13%), Zimbabwean (5.4%, a difference of 0.21%), Immigrants from Nepal (5.4%, a difference of 0.25%), and Ethiopian (5.4%, a difference of 0.37%).
| Demographics | Rating | Rank | Ambulatory Disability |
| Immigrants | China | 100.0 /100 | #15 | Exceptional 5.3% |
| Immigrants | Hong Kong | 100.0 /100 | #16 | Exceptional 5.3% |
| Immigrants | Ethiopia | 100.0 /100 | #17 | Exceptional 5.4% |
| Immigrants | Sri Lanka | 100.0 /100 | #18 | Exceptional 5.4% |
| Indians (Asian) | 100.0 /100 | #19 | Exceptional 5.4% |
| Ethiopians | 100.0 /100 | #20 | Exceptional 5.4% |
| Immigrants | Kuwait | 100.0 /100 | #21 | Exceptional 5.4% |
| Immigrants | Israel | 100.0 /100 | #22 | Exceptional 5.4% |
| Tongans | 100.0 /100 | #23 | Exceptional 5.4% |
| Immigrants | Saudi Arabia | 100.0 /100 | #24 | Exceptional 5.4% |
| Zimbabweans | 100.0 /100 | #25 | Exceptional 5.4% |
| Immigrants | Nepal | 100.0 /100 | #26 | Exceptional 5.4% |
| Asians | 100.0 /100 | #27 | Exceptional 5.4% |
| Cambodians | 100.0 /100 | #28 | Exceptional 5.4% |
| Immigrants | Iran | 100.0 /100 | #29 | Exceptional 5.4% |
Demographics Similar to Hungarians by Ambulatory Disability
In terms of ambulatory disability, the demographic groups most similar to Hungarians are Immigrants from Albania (6.3%, a difference of 0.010%), German Russian (6.3%, a difference of 0.030%), Indonesian (6.3%, a difference of 0.050%), Guamanian/Chamorro (6.3%, a difference of 0.14%), and Yugoslavian (6.3%, a difference of 0.18%).
| Demographics | Rating | Rank | Ambulatory Disability |
| Immigrants | Mexico | 11.0 /100 | #214 | Poor 6.3% |
| Immigrants | Latin America | 11.0 /100 | #215 | Poor 6.3% |
| Canadians | 10.9 /100 | #216 | Poor 6.3% |
| Yugoslavians | 10.9 /100 | #217 | Poor 6.3% |
| Guamanians/Chamorros | 10.6 /100 | #218 | Poor 6.3% |
| Indonesians | 9.9 /100 | #219 | Tragic 6.3% |
| Immigrants | Albania | 9.6 /100 | #220 | Tragic 6.3% |
| Hungarians | 9.6 /100 | #221 | Tragic 6.3% |
| German Russians | 9.4 /100 | #222 | Tragic 6.3% |
| Immigrants | Honduras | 7.6 /100 | #223 | Tragic 6.3% |
| Liberians | 7.1 /100 | #224 | Tragic 6.3% |
| Hondurans | 6.3 /100 | #225 | Tragic 6.3% |
| Slavs | 5.1 /100 | #226 | Tragic 6.4% |
| Cubans | 4.0 /100 | #227 | Tragic 6.4% |
| Portuguese | 4.0 /100 | #228 | Tragic 6.4% |