Immigrants from Armenia vs Hungarian Ambulatory Disability
COMPARE
Immigrants from Armenia
Hungarian
Ambulatory Disability
Ambulatory Disability Comparison
Immigrants from Armenia
Hungarians
7.0%
AMBULATORY DISABILITY
0.0/ 100
METRIC RATING
302nd/ 347
METRIC RANK
6.3%
AMBULATORY DISABILITY
9.6/ 100
METRIC RATING
221st/ 347
METRIC RANK
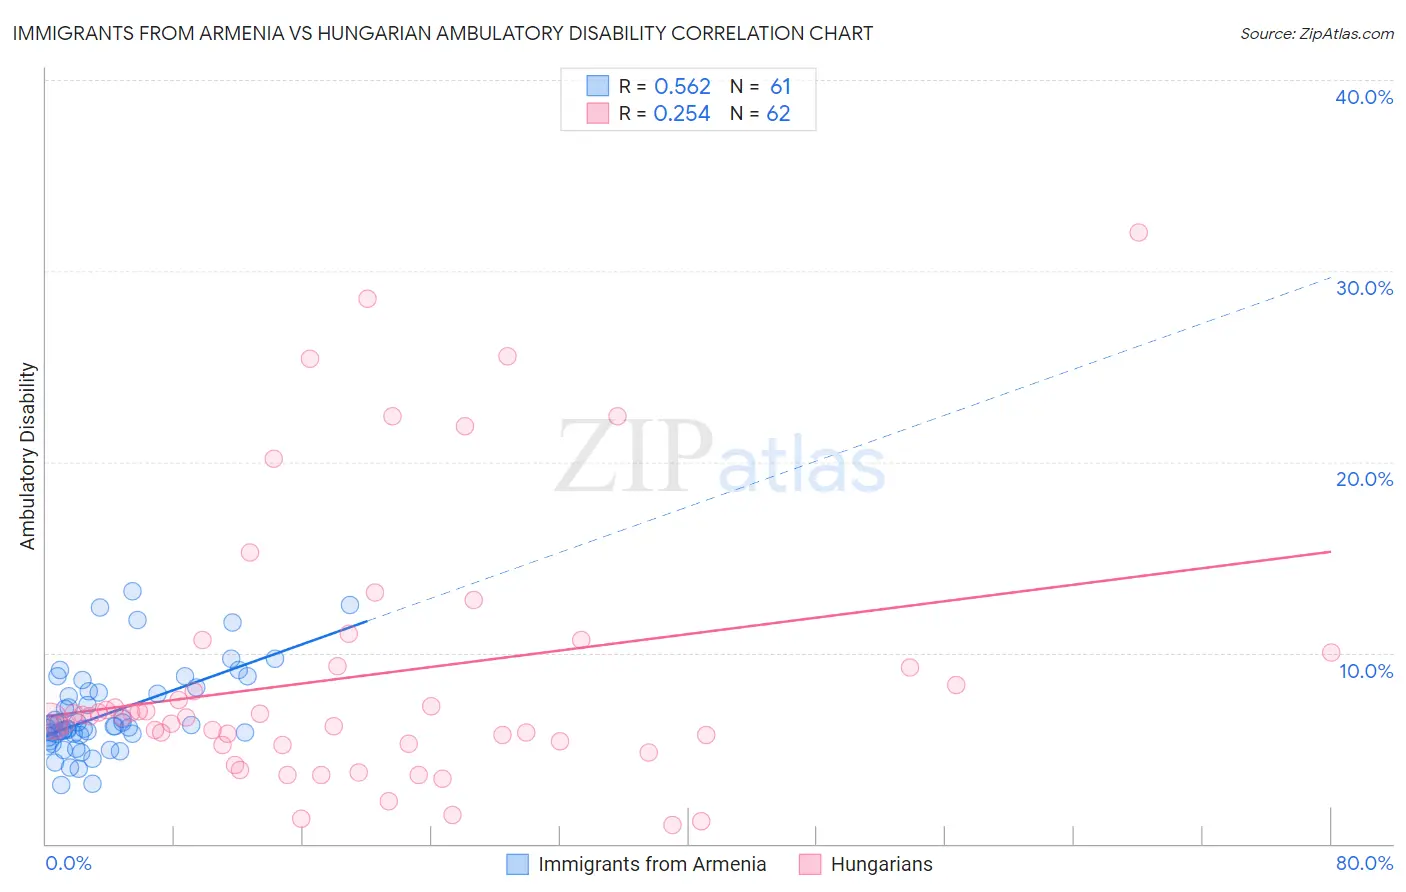
Immigrants from Armenia vs Hungarian Ambulatory Disability Correlation Chart
The statistical analysis conducted on geographies consisting of 97,709,765 people shows a substantial positive correlation between the proportion of Immigrants from Armenia and percentage of population with ambulatory disability in the United States with a correlation coefficient (R) of 0.562 and weighted average of 7.0%. Similarly, the statistical analysis conducted on geographies consisting of 486,018,761 people shows a weak positive correlation between the proportion of Hungarians and percentage of population with ambulatory disability in the United States with a correlation coefficient (R) of 0.254 and weighted average of 6.3%, a difference of 10.6%.
Ambulatory Disability Correlation Summary
| Measurement | Immigrants from Armenia | Hungarian |
| Minimum | 3.1% | 1.0% |
| Maximum | 13.3% | 32.0% |
| Range | 10.2% | 31.0% |
| Mean | 6.8% | 8.8% |
| Median | 6.2% | 6.7% |
| Interquartile 25% (IQ1) | 5.6% | 5.2% |
| Interquartile 75% (IQ3) | 8.0% | 9.3% |
| Interquartile Range (IQR) | 2.3% | 4.1% |
| Standard Deviation (Sample) | 2.2% | 6.9% |
| Standard Deviation (Population) | 2.2% | 6.8% |
Similar Demographics by Ambulatory Disability
Demographics Similar to Immigrants from Armenia by Ambulatory Disability
In terms of ambulatory disability, the demographic groups most similar to Immigrants from Armenia are British West Indian (7.0%, a difference of 0.060%), African (7.0%, a difference of 0.060%), Marshallese (6.9%, a difference of 0.28%), Puget Sound Salish (6.9%, a difference of 0.30%), and Immigrants from Cabo Verde (7.0%, a difference of 0.42%).
| Demographics | Rating | Rank | Ambulatory Disability |
| Crow | 0.0 /100 | #295 | Tragic 6.9% |
| Alaskan Athabascans | 0.0 /100 | #296 | Tragic 6.9% |
| French American Indians | 0.0 /100 | #297 | Tragic 6.9% |
| Immigrants | Grenada | 0.0 /100 | #298 | Tragic 6.9% |
| Puget Sound Salish | 0.0 /100 | #299 | Tragic 6.9% |
| Marshallese | 0.0 /100 | #300 | Tragic 6.9% |
| British West Indians | 0.0 /100 | #301 | Tragic 7.0% |
| Immigrants | Armenia | 0.0 /100 | #302 | Tragic 7.0% |
| Africans | 0.0 /100 | #303 | Tragic 7.0% |
| Immigrants | Cabo Verde | 0.0 /100 | #304 | Tragic 7.0% |
| Immigrants | Micronesia | 0.0 /100 | #305 | Tragic 7.0% |
| Iroquois | 0.0 /100 | #306 | Tragic 7.1% |
| Spanish Americans | 0.0 /100 | #307 | Tragic 7.1% |
| Chippewa | 0.0 /100 | #308 | Tragic 7.1% |
| Immigrants | Azores | 0.0 /100 | #309 | Tragic 7.1% |
Demographics Similar to Hungarians by Ambulatory Disability
In terms of ambulatory disability, the demographic groups most similar to Hungarians are Immigrants from Albania (6.3%, a difference of 0.010%), German Russian (6.3%, a difference of 0.030%), Indonesian (6.3%, a difference of 0.050%), Guamanian/Chamorro (6.3%, a difference of 0.14%), and Yugoslavian (6.3%, a difference of 0.18%).
| Demographics | Rating | Rank | Ambulatory Disability |
| Immigrants | Mexico | 11.0 /100 | #214 | Poor 6.3% |
| Immigrants | Latin America | 11.0 /100 | #215 | Poor 6.3% |
| Canadians | 10.9 /100 | #216 | Poor 6.3% |
| Yugoslavians | 10.9 /100 | #217 | Poor 6.3% |
| Guamanians/Chamorros | 10.6 /100 | #218 | Poor 6.3% |
| Indonesians | 9.9 /100 | #219 | Tragic 6.3% |
| Immigrants | Albania | 9.6 /100 | #220 | Tragic 6.3% |
| Hungarians | 9.6 /100 | #221 | Tragic 6.3% |
| German Russians | 9.4 /100 | #222 | Tragic 6.3% |
| Immigrants | Honduras | 7.6 /100 | #223 | Tragic 6.3% |
| Liberians | 7.1 /100 | #224 | Tragic 6.3% |
| Hondurans | 6.3 /100 | #225 | Tragic 6.3% |
| Slavs | 5.1 /100 | #226 | Tragic 6.4% |
| Cubans | 4.0 /100 | #227 | Tragic 6.4% |
| Portuguese | 4.0 /100 | #228 | Tragic 6.4% |