Thai vs Panamanian Female Poverty Among 18-24 Year Olds
COMPARE
Thai
Panamanian
Female Poverty Among 18-24 Year Olds
Female Poverty Among 18-24 Year Olds Comparison
Thais
Panamanians
17.0%
FEMALE POVERTY AMONG 18-24 YEAR OLDS
100.0/ 100
METRIC RATING
11th/ 347
METRIC RANK
19.7%
FEMALE POVERTY AMONG 18-24 YEAR OLDS
84.6/ 100
METRIC RATING
142nd/ 347
METRIC RANK
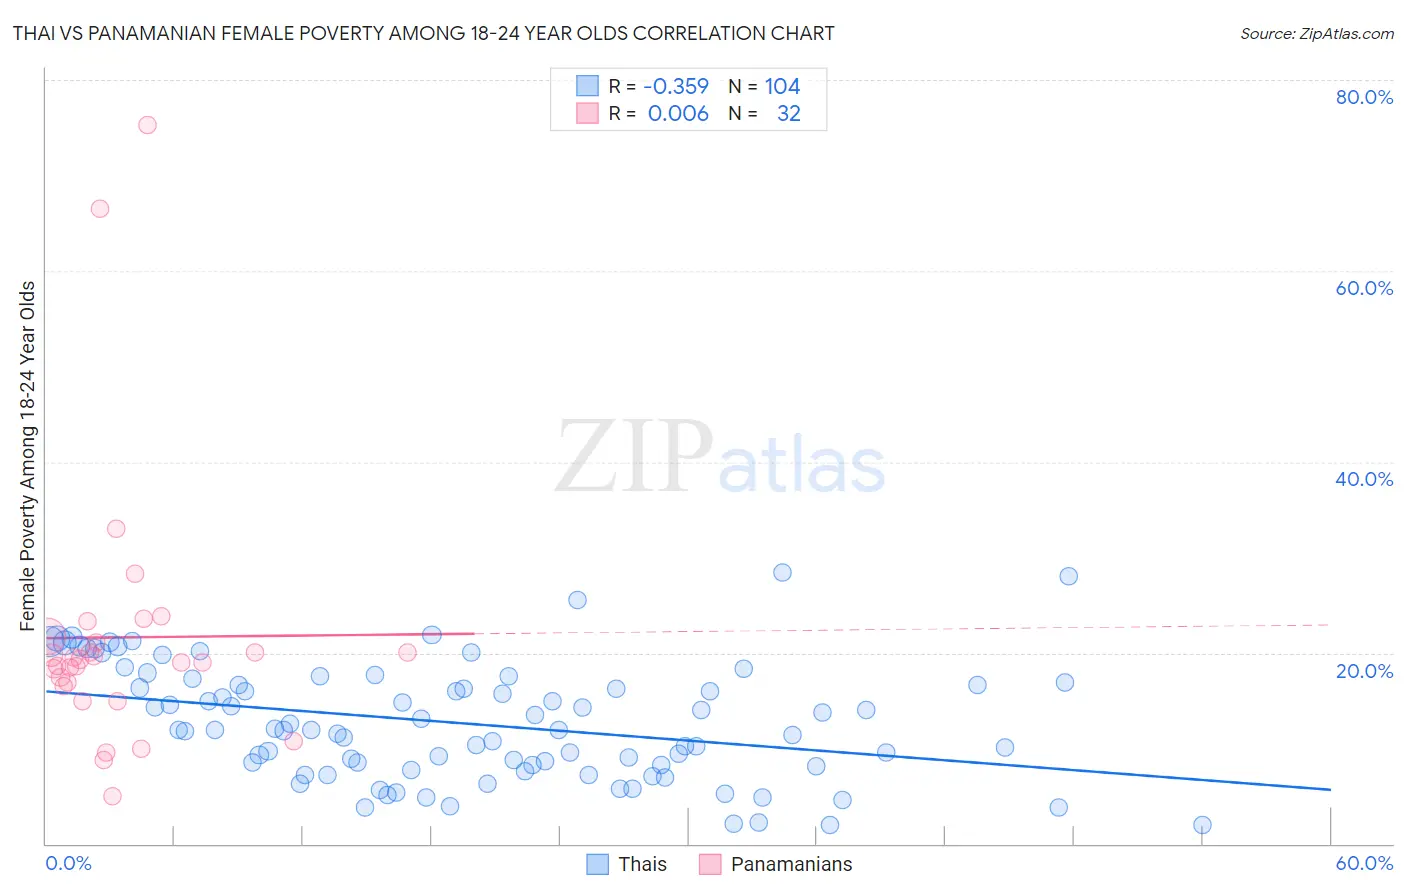
Thai vs Panamanian Female Poverty Among 18-24 Year Olds Correlation Chart
The statistical analysis conducted on geographies consisting of 460,499,856 people shows a mild negative correlation between the proportion of Thais and poverty level among females between the ages 18 and 24 in the United States with a correlation coefficient (R) of -0.359 and weighted average of 17.0%. Similarly, the statistical analysis conducted on geographies consisting of 277,422,318 people shows no correlation between the proportion of Panamanians and poverty level among females between the ages 18 and 24 in the United States with a correlation coefficient (R) of 0.006 and weighted average of 19.7%, a difference of 15.9%.
Female Poverty Among 18-24 Year Olds Correlation Summary
| Measurement | Thai | Panamanian |
| Minimum | 1.9% | 5.0% |
| Maximum | 28.4% | 75.3% |
| Range | 26.5% | 70.3% |
| Mean | 12.6% | 21.6% |
| Median | 11.9% | 19.2% |
| Interquartile 25% (IQ1) | 8.1% | 16.7% |
| Interquartile 75% (IQ3) | 16.8% | 21.4% |
| Interquartile Range (IQR) | 8.7% | 4.6% |
| Standard Deviation (Sample) | 6.0% | 14.1% |
| Standard Deviation (Population) | 6.0% | 13.9% |
Similar Demographics by Female Poverty Among 18-24 Year Olds
Demographics Similar to Thais by Female Poverty Among 18-24 Year Olds
In terms of female poverty among 18-24 year olds, the demographic groups most similar to Thais are Immigrants from Pakistan (17.0%, a difference of 0.090%), Korean (16.9%, a difference of 0.27%), Immigrants from Peru (16.9%, a difference of 0.63%), Immigrants from Poland (17.1%, a difference of 0.75%), and Tongan (17.1%, a difference of 0.93%).
| Demographics | Rating | Rank | Female Poverty Among 18-24 Year Olds |
| Immigrants | India | 100.0 /100 | #4 | Exceptional 16.4% |
| Immigrants | Portugal | 100.0 /100 | #5 | Exceptional 16.5% |
| Immigrants | Philippines | 100.0 /100 | #6 | Exceptional 16.7% |
| Immigrants | Azores | 100.0 /100 | #7 | Exceptional 16.7% |
| Immigrants | Bolivia | 100.0 /100 | #8 | Exceptional 16.7% |
| Immigrants | Peru | 100.0 /100 | #9 | Exceptional 16.9% |
| Koreans | 100.0 /100 | #10 | Exceptional 16.9% |
| Thais | 100.0 /100 | #11 | Exceptional 17.0% |
| Immigrants | Pakistan | 100.0 /100 | #12 | Exceptional 17.0% |
| Immigrants | Poland | 100.0 /100 | #13 | Exceptional 17.1% |
| Tongans | 100.0 /100 | #14 | Exceptional 17.1% |
| Cubans | 100.0 /100 | #15 | Exceptional 17.2% |
| Peruvians | 100.0 /100 | #16 | Exceptional 17.2% |
| Immigrants | Taiwan | 100.0 /100 | #17 | Exceptional 17.3% |
| Immigrants | Colombia | 100.0 /100 | #18 | Exceptional 17.3% |
Demographics Similar to Panamanians by Female Poverty Among 18-24 Year Olds
In terms of female poverty among 18-24 year olds, the demographic groups most similar to Panamanians are Slavic (19.7%, a difference of 0.010%), Immigrants from Northern Africa (19.7%, a difference of 0.040%), Canadian (19.7%, a difference of 0.070%), Pennsylvania German (19.7%, a difference of 0.090%), and Immigrants from Bosnia and Herzegovina (19.7%, a difference of 0.090%).
| Demographics | Rating | Rank | Female Poverty Among 18-24 Year Olds |
| Soviet Union | 92.0 /100 | #135 | Exceptional 19.5% |
| Russians | 91.5 /100 | #136 | Exceptional 19.5% |
| Austrians | 90.7 /100 | #137 | Exceptional 19.5% |
| Immigrants | Morocco | 89.9 /100 | #138 | Excellent 19.6% |
| Indians (Asian) | 88.3 /100 | #139 | Excellent 19.6% |
| Immigrants | Trinidad and Tobago | 85.6 /100 | #140 | Excellent 19.7% |
| Pennsylvania Germans | 85.5 /100 | #141 | Excellent 19.7% |
| Panamanians | 84.6 /100 | #142 | Excellent 19.7% |
| Slavs | 84.4 /100 | #143 | Excellent 19.7% |
| Immigrants | Northern Africa | 84.1 /100 | #144 | Excellent 19.7% |
| Canadians | 83.8 /100 | #145 | Excellent 19.7% |
| Immigrants | Bosnia and Herzegovina | 83.6 /100 | #146 | Excellent 19.7% |
| Immigrants | Austria | 83.1 /100 | #147 | Excellent 19.7% |
| Immigrants | Latin America | 81.3 /100 | #148 | Excellent 19.7% |
| Immigrants | Oceania | 81.2 /100 | #149 | Excellent 19.7% |