Thai vs Immigrants from Uruguay Ambulatory Disability
COMPARE
Thai
Immigrants from Uruguay
Ambulatory Disability
Ambulatory Disability Comparison
Thais
Immigrants from Uruguay
4.9%
AMBULATORY DISABILITY
100.0/ 100
METRIC RATING
3rd/ 347
METRIC RANK
5.9%
AMBULATORY DISABILITY
95.6/ 100
METRIC RATING
113th/ 347
METRIC RANK
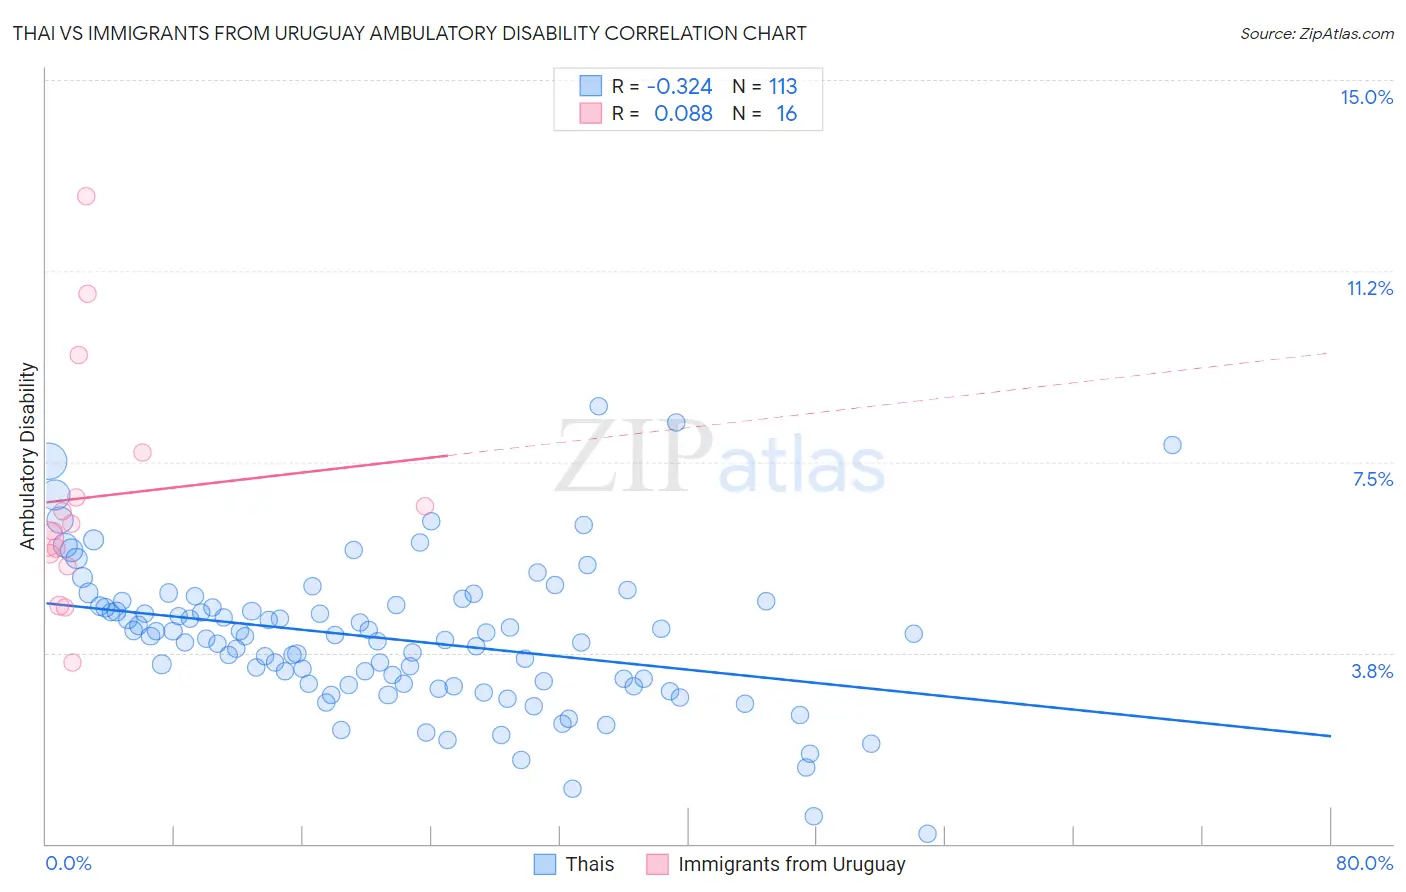
Thai vs Immigrants from Uruguay Ambulatory Disability Correlation Chart
The statistical analysis conducted on geographies consisting of 475,631,146 people shows a mild negative correlation between the proportion of Thais and percentage of population with ambulatory disability in the United States with a correlation coefficient (R) of -0.324 and weighted average of 4.9%. Similarly, the statistical analysis conducted on geographies consisting of 133,255,356 people shows a slight positive correlation between the proportion of Immigrants from Uruguay and percentage of population with ambulatory disability in the United States with a correlation coefficient (R) of 0.088 and weighted average of 5.9%, a difference of 19.2%.
Ambulatory Disability Correlation Summary
| Measurement | Thai | Immigrants from Uruguay |
| Minimum | 0.18% | 3.6% |
| Maximum | 8.6% | 12.7% |
| Range | 8.4% | 9.2% |
| Mean | 4.0% | 6.8% |
| Median | 4.1% | 6.2% |
| Interquartile 25% (IQ1) | 3.1% | 5.6% |
| Interquartile 75% (IQ3) | 4.7% | 7.2% |
| Interquartile Range (IQR) | 1.5% | 1.7% |
| Standard Deviation (Sample) | 1.4% | 2.4% |
| Standard Deviation (Population) | 1.4% | 2.3% |
Similar Demographics by Ambulatory Disability
Demographics Similar to Thais by Ambulatory Disability
In terms of ambulatory disability, the demographic groups most similar to Thais are Immigrants from Taiwan (4.9%, a difference of 0.24%), Filipino (4.9%, a difference of 1.2%), Immigrants from Singapore (5.0%, a difference of 1.6%), Immigrants from Bolivia (5.0%, a difference of 2.3%), and Bolivian (5.1%, a difference of 2.7%).
| Demographics | Rating | Rank | Ambulatory Disability |
| Immigrants | India | 100.0 /100 | #1 | Exceptional 4.8% |
| Filipinos | 100.0 /100 | #2 | Exceptional 4.9% |
| Thais | 100.0 /100 | #3 | Exceptional 4.9% |
| Immigrants | Taiwan | 100.0 /100 | #4 | Exceptional 4.9% |
| Immigrants | Singapore | 100.0 /100 | #5 | Exceptional 5.0% |
| Immigrants | Bolivia | 100.0 /100 | #6 | Exceptional 5.0% |
| Bolivians | 100.0 /100 | #7 | Exceptional 5.1% |
| Immigrants | South Central Asia | 100.0 /100 | #8 | Exceptional 5.1% |
| Iranians | 100.0 /100 | #9 | Exceptional 5.1% |
| Yup'ik | 100.0 /100 | #10 | Exceptional 5.2% |
| Immigrants | Korea | 100.0 /100 | #11 | Exceptional 5.2% |
| Okinawans | 100.0 /100 | #12 | Exceptional 5.3% |
| Burmese | 100.0 /100 | #13 | Exceptional 5.3% |
| Immigrants | Eastern Asia | 100.0 /100 | #14 | Exceptional 5.3% |
| Immigrants | China | 100.0 /100 | #15 | Exceptional 5.3% |
Demographics Similar to Immigrants from Uruguay by Ambulatory Disability
In terms of ambulatory disability, the demographic groups most similar to Immigrants from Uruguay are Immigrants from Poland (5.9%, a difference of 0.060%), South African (5.9%, a difference of 0.22%), South American Indian (5.9%, a difference of 0.26%), Immigrants from Africa (5.9%, a difference of 0.28%), and Danish (5.8%, a difference of 0.35%).
| Demographics | Rating | Rank | Ambulatory Disability |
| Immigrants | Morocco | 97.3 /100 | #106 | Exceptional 5.8% |
| Uruguayans | 97.2 /100 | #107 | Exceptional 5.8% |
| Colombians | 97.2 /100 | #108 | Exceptional 5.8% |
| Immigrants | Netherlands | 97.1 /100 | #109 | Exceptional 5.8% |
| Immigrants | Colombia | 96.7 /100 | #110 | Exceptional 5.8% |
| Danes | 96.6 /100 | #111 | Exceptional 5.8% |
| South Africans | 96.3 /100 | #112 | Exceptional 5.9% |
| Immigrants | Uruguay | 95.6 /100 | #113 | Exceptional 5.9% |
| Immigrants | Poland | 95.4 /100 | #114 | Exceptional 5.9% |
| South American Indians | 94.8 /100 | #115 | Exceptional 5.9% |
| Immigrants | Africa | 94.7 /100 | #116 | Exceptional 5.9% |
| Immigrants | South Eastern Asia | 93.6 /100 | #117 | Exceptional 5.9% |
| Russians | 93.4 /100 | #118 | Exceptional 5.9% |
| Norwegians | 93.1 /100 | #119 | Exceptional 5.9% |
| Estonians | 92.9 /100 | #120 | Exceptional 5.9% |