Thai vs Immigrants from Uruguay 10th Grade
COMPARE
Thai
Immigrants from Uruguay
10th Grade
10th Grade Comparison
Thais
Immigrants from Uruguay
95.0%
10TH GRADE
99.8/ 100
METRIC RATING
62nd/ 347
METRIC RANK
92.5%
10TH GRADE
0.3/ 100
METRIC RATING
270th/ 347
METRIC RANK
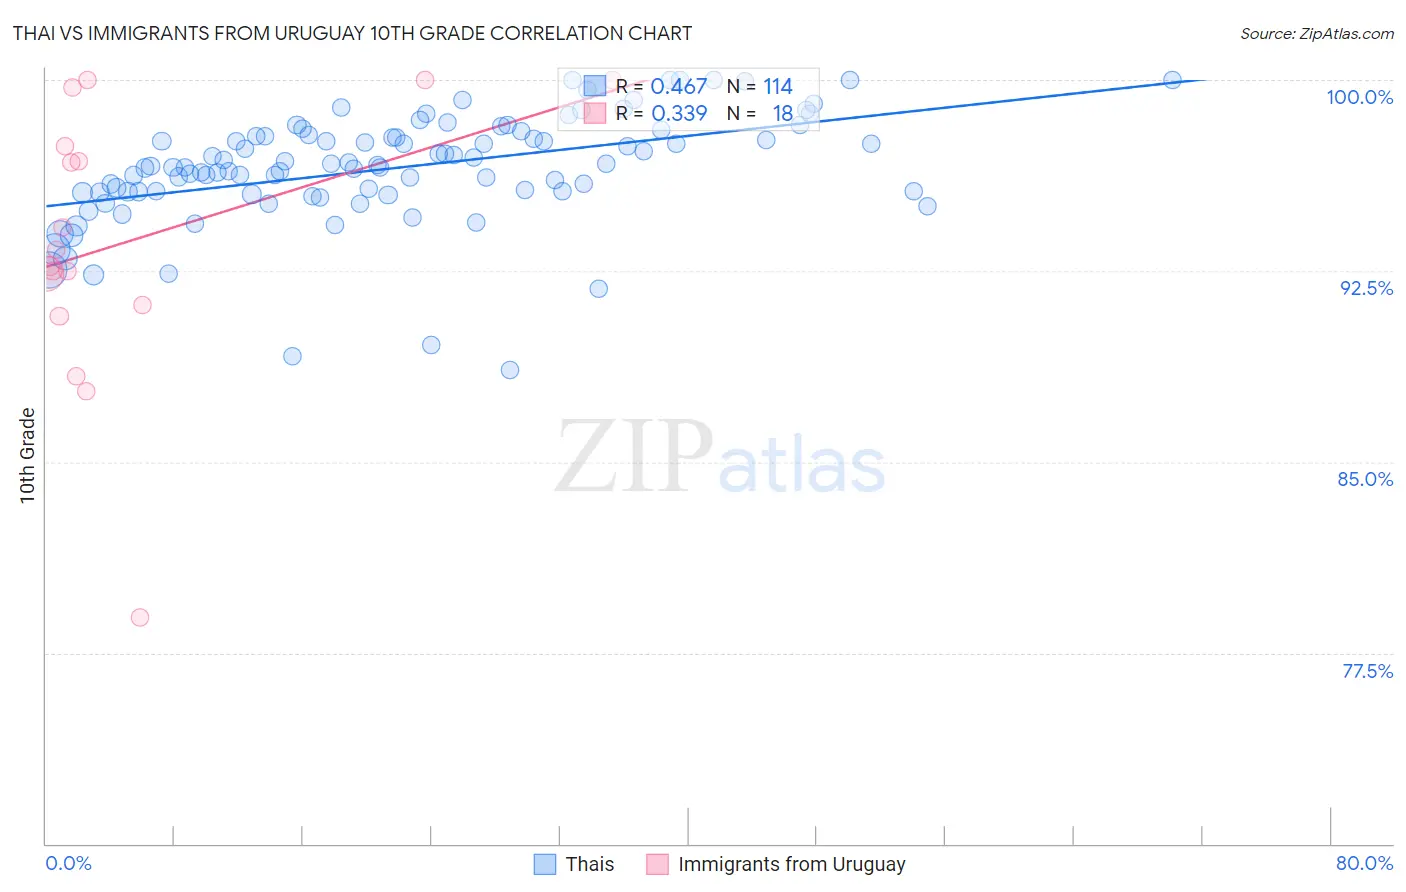
Thai vs Immigrants from Uruguay 10th Grade Correlation Chart
The statistical analysis conducted on geographies consisting of 475,814,962 people shows a moderate positive correlation between the proportion of Thais and percentage of population with at least 10th grade education in the United States with a correlation coefficient (R) of 0.467 and weighted average of 95.0%. Similarly, the statistical analysis conducted on geographies consisting of 133,259,667 people shows a mild positive correlation between the proportion of Immigrants from Uruguay and percentage of population with at least 10th grade education in the United States with a correlation coefficient (R) of 0.339 and weighted average of 92.5%, a difference of 2.7%.
10th Grade Correlation Summary
| Measurement | Thai | Immigrants from Uruguay |
| Minimum | 88.6% | 78.9% |
| Maximum | 100.0% | 100.0% |
| Range | 11.4% | 21.1% |
| Mean | 96.5% | 93.6% |
| Median | 96.6% | 93.0% |
| Interquartile 25% (IQ1) | 95.6% | 91.2% |
| Interquartile 75% (IQ3) | 97.8% | 97.4% |
| Interquartile Range (IQR) | 2.2% | 6.2% |
| Standard Deviation (Sample) | 2.2% | 5.4% |
| Standard Deviation (Population) | 2.1% | 5.2% |
Similar Demographics by 10th Grade
Demographics Similar to Thais by 10th Grade
In terms of 10th grade, the demographic groups most similar to Thais are Immigrants from Singapore (95.0%, a difference of 0.0%), Cypriot (95.0%, a difference of 0.010%), Chippewa (95.0%, a difference of 0.010%), Native Hawaiian (95.0%, a difference of 0.010%), and Ukrainian (95.0%, a difference of 0.020%).
| Demographics | Rating | Rank | 10th Grade |
| Immigrants | Ireland | 99.8 /100 | #55 | Exceptional 95.0% |
| New Zealanders | 99.8 /100 | #56 | Exceptional 95.0% |
| Ukrainians | 99.8 /100 | #57 | Exceptional 95.0% |
| Aleuts | 99.8 /100 | #58 | Exceptional 95.0% |
| Celtics | 99.8 /100 | #59 | Exceptional 95.0% |
| Cypriots | 99.8 /100 | #60 | Exceptional 95.0% |
| Chippewa | 99.8 /100 | #61 | Exceptional 95.0% |
| Thais | 99.8 /100 | #62 | Exceptional 95.0% |
| Immigrants | Singapore | 99.8 /100 | #63 | Exceptional 95.0% |
| Native Hawaiians | 99.7 /100 | #64 | Exceptional 95.0% |
| Turks | 99.7 /100 | #65 | Exceptional 95.0% |
| Immigrants | Australia | 99.7 /100 | #66 | Exceptional 94.9% |
| Immigrants | Netherlands | 99.7 /100 | #67 | Exceptional 94.9% |
| Immigrants | Belgium | 99.7 /100 | #68 | Exceptional 94.9% |
| Immigrants | England | 99.6 /100 | #69 | Exceptional 94.9% |
Demographics Similar to Immigrants from Uruguay by 10th Grade
In terms of 10th grade, the demographic groups most similar to Immigrants from Uruguay are Immigrants from Colombia (92.5%, a difference of 0.0%), Immigrants from Eritrea (92.5%, a difference of 0.010%), Taiwanese (92.5%, a difference of 0.020%), Immigrants from Ghana (92.5%, a difference of 0.020%), and Immigrants from Western Africa (92.5%, a difference of 0.020%).
| Demographics | Rating | Rank | 10th Grade |
| Apache | 0.4 /100 | #263 | Tragic 92.6% |
| Peruvians | 0.4 /100 | #264 | Tragic 92.6% |
| Dutch West Indians | 0.4 /100 | #265 | Tragic 92.6% |
| Immigrants | Philippines | 0.4 /100 | #266 | Tragic 92.6% |
| Taiwanese | 0.3 /100 | #267 | Tragic 92.5% |
| Immigrants | Ghana | 0.3 /100 | #268 | Tragic 92.5% |
| Immigrants | Colombia | 0.3 /100 | #269 | Tragic 92.5% |
| Immigrants | Uruguay | 0.3 /100 | #270 | Tragic 92.5% |
| Immigrants | Eritrea | 0.3 /100 | #271 | Tragic 92.5% |
| Immigrants | Western Africa | 0.3 /100 | #272 | Tragic 92.5% |
| Trinidadians and Tobagonians | 0.2 /100 | #273 | Tragic 92.4% |
| Immigrants | Congo | 0.2 /100 | #274 | Tragic 92.4% |
| West Indians | 0.2 /100 | #275 | Tragic 92.4% |
| Immigrants | Trinidad and Tobago | 0.1 /100 | #276 | Tragic 92.3% |
| Navajo | 0.1 /100 | #277 | Tragic 92.3% |